Chinese vs Immigrants from Japan Male Unemployment
COMPARE
Chinese
Immigrants from Japan
Male Unemployment
Male Unemployment Comparison
Chinese
Immigrants from Japan
4.9%
MALE UNEMPLOYMENT
99.3/ 100
METRIC RATING
41st/ 347
METRIC RANK
4.9%
MALE UNEMPLOYMENT
99.2/ 100
METRIC RATING
43rd/ 347
METRIC RANK
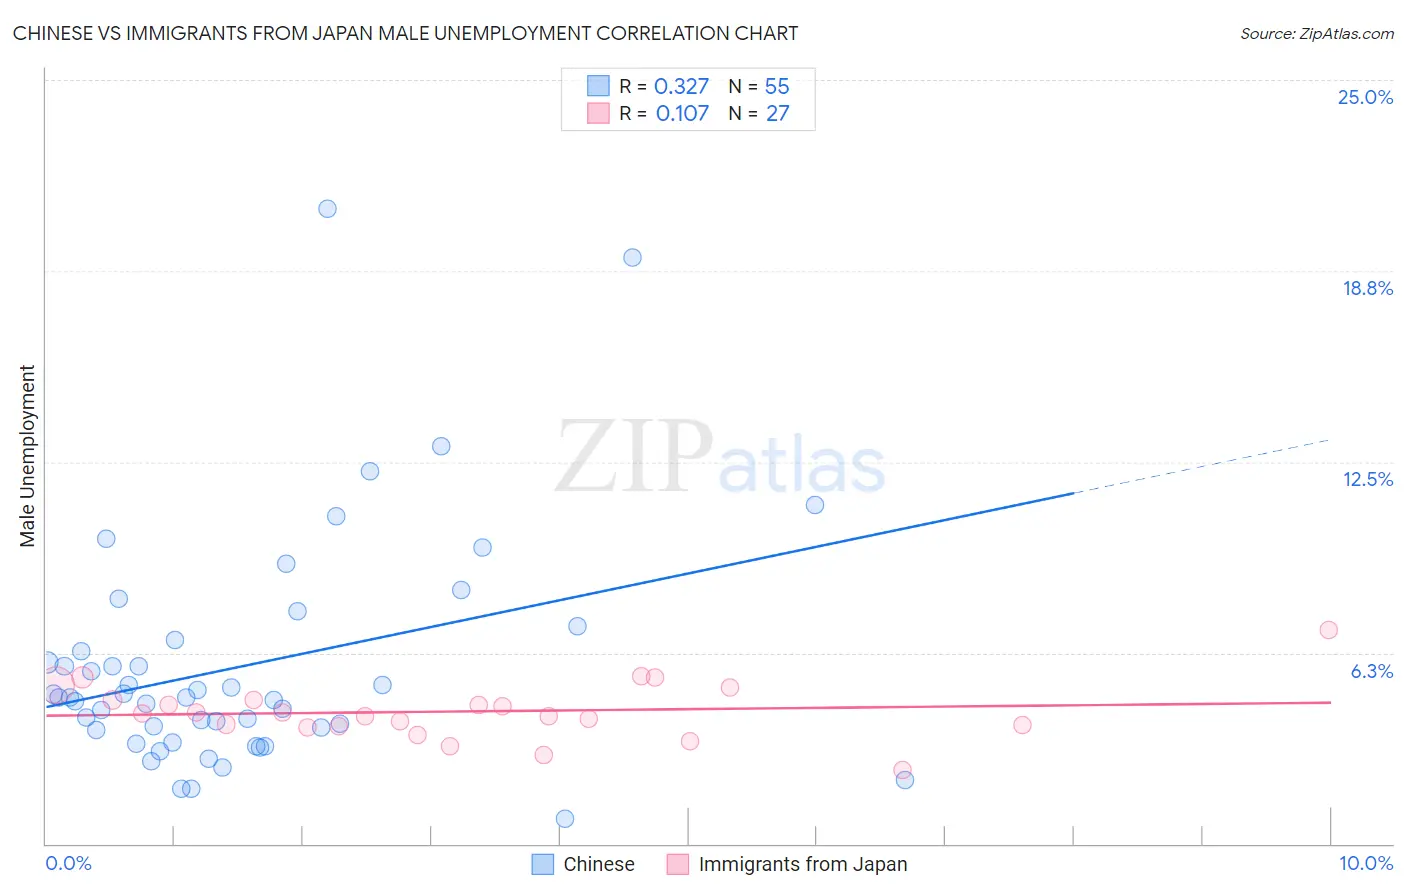
Chinese vs Immigrants from Japan Male Unemployment Correlation Chart
The statistical analysis conducted on geographies consisting of 64,756,701 people shows a mild positive correlation between the proportion of Chinese and unemployment rate among males in the United States with a correlation coefficient (R) of 0.327 and weighted average of 4.9%. Similarly, the statistical analysis conducted on geographies consisting of 339,113,647 people shows a poor positive correlation between the proportion of Immigrants from Japan and unemployment rate among males in the United States with a correlation coefficient (R) of 0.107 and weighted average of 4.9%, a difference of 0.13%.
Male Unemployment Correlation Summary
| Measurement | Chinese | Immigrants from Japan |
| Minimum | 0.80% | 2.4% |
| Maximum | 20.8% | 7.0% |
| Range | 20.0% | 4.6% |
| Mean | 5.8% | 4.3% |
| Median | 4.8% | 4.3% |
| Interquartile 25% (IQ1) | 3.7% | 3.8% |
| Interquartile 75% (IQ3) | 6.7% | 4.7% |
| Interquartile Range (IQR) | 2.9% | 0.88% |
| Standard Deviation (Sample) | 3.8% | 0.93% |
| Standard Deviation (Population) | 3.8% | 0.91% |
Demographics Similar to Chinese and Immigrants from Japan by Male Unemployment
In terms of male unemployment, the demographic groups most similar to Chinese are Immigrants from Belgium (4.9%, a difference of 0.020%), Northern European (4.9%, a difference of 0.080%), Burmese (4.9%, a difference of 0.17%), Immigrants from Bosnia and Herzegovina (4.9%, a difference of 0.24%), and Scotch-Irish (4.9%, a difference of 0.26%). Similarly, the demographic groups most similar to Immigrants from Japan are Immigrants from Belgium (4.9%, a difference of 0.10%), Immigrants from Korea (4.9%, a difference of 0.18%), Northern European (4.9%, a difference of 0.21%), Burmese (4.9%, a difference of 0.29%), and Immigrants from Zimbabwe (4.9%, a difference of 0.33%).
| Demographics | Rating | Rank | Male Unemployment |
| Immigrants | Nepal | 99.8 /100 | #32 | Exceptional 4.8% |
| Latvians | 99.7 /100 | #33 | Exceptional 4.8% |
| Welsh | 99.7 /100 | #34 | Exceptional 4.8% |
| Paraguayans | 99.5 /100 | #35 | Exceptional 4.9% |
| Immigrants | Singapore | 99.4 /100 | #36 | Exceptional 4.9% |
| Scotch-Irish | 99.4 /100 | #37 | Exceptional 4.9% |
| Immigrants | Bosnia and Herzegovina | 99.4 /100 | #38 | Exceptional 4.9% |
| Burmese | 99.3 /100 | #39 | Exceptional 4.9% |
| Northern Europeans | 99.3 /100 | #40 | Exceptional 4.9% |
| Chinese | 99.3 /100 | #41 | Exceptional 4.9% |
| Immigrants | Belgium | 99.2 /100 | #42 | Exceptional 4.9% |
| Immigrants | Japan | 99.2 /100 | #43 | Exceptional 4.9% |
| Immigrants | Korea | 99.1 /100 | #44 | Exceptional 4.9% |
| Immigrants | Zimbabwe | 99.0 /100 | #45 | Exceptional 4.9% |
| Bhutanese | 98.9 /100 | #46 | Exceptional 4.9% |
| Austrians | 98.9 /100 | #47 | Exceptional 4.9% |
| Immigrants | Scotland | 98.9 /100 | #48 | Exceptional 4.9% |
| Poles | 98.9 /100 | #49 | Exceptional 4.9% |
| Croatians | 98.9 /100 | #50 | Exceptional 4.9% |
| Slovenes | 98.8 /100 | #51 | Exceptional 5.0% |
| Irish | 98.8 /100 | #52 | Exceptional 5.0% |