Celtic vs Pakistani 1 or more Vehicles in Household
COMPARE
Celtic
Pakistani
1 or more Vehicles in Household
1 or more Vehicles in Household Comparison
Celtics
Pakistanis
92.1%
1 OR MORE VEHICLES IN HOUSEHOLD
99.9/ 100
METRIC RATING
51st/ 347
METRIC RANK
91.3%
1 OR MORE VEHICLES IN HOUSEHOLD
99.0/ 100
METRIC RATING
97th/ 347
METRIC RANK
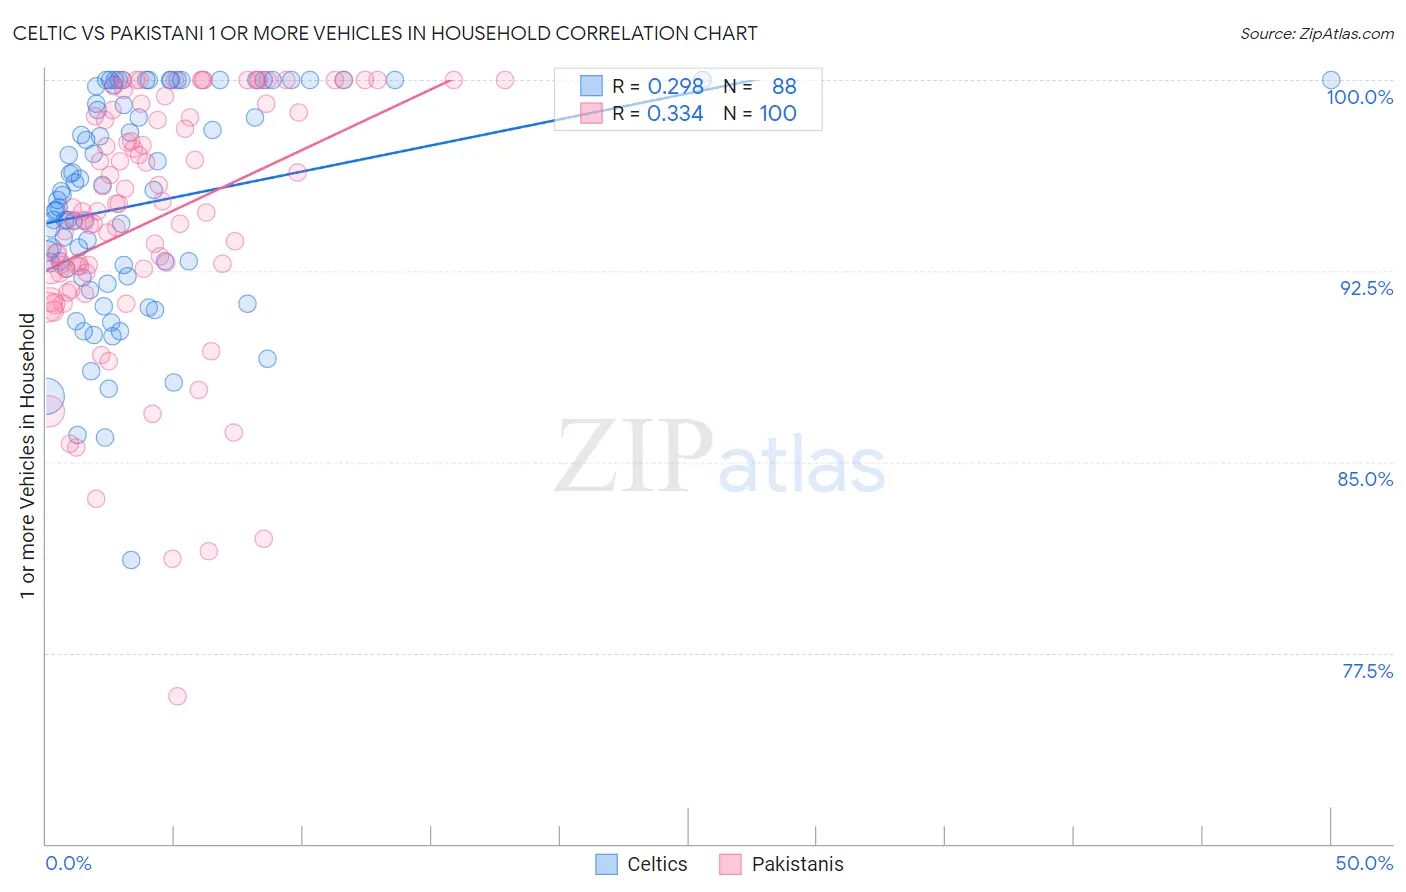
Celtic vs Pakistani 1 or more Vehicles in Household Correlation Chart
The statistical analysis conducted on geographies consisting of 168,861,273 people shows a weak positive correlation between the proportion of Celtics and percentage of households with 1 or more vehicles available in the United States with a correlation coefficient (R) of 0.298 and weighted average of 92.1%. Similarly, the statistical analysis conducted on geographies consisting of 335,009,492 people shows a mild positive correlation between the proportion of Pakistanis and percentage of households with 1 or more vehicles available in the United States with a correlation coefficient (R) of 0.334 and weighted average of 91.3%, a difference of 0.88%.
1 or more Vehicles in Household Correlation Summary
| Measurement | Celtic | Pakistani |
| Minimum | 81.1% | 75.8% |
| Maximum | 100.0% | 100.0% |
| Range | 18.9% | 24.2% |
| Mean | 95.2% | 94.5% |
| Median | 95.4% | 94.8% |
| Interquartile 25% (IQ1) | 92.4% | 92.4% |
| Interquartile 75% (IQ3) | 99.8% | 98.6% |
| Interquartile Range (IQR) | 7.4% | 6.2% |
| Standard Deviation (Sample) | 4.2% | 5.0% |
| Standard Deviation (Population) | 4.2% | 4.9% |
Similar Demographics by 1 or more Vehicles in Household
Demographics Similar to Celtics by 1 or more Vehicles in Household
In terms of 1 or more vehicles in household, the demographic groups most similar to Celtics are Guamanian/Chamorro (92.1%, a difference of 0.010%), Afghan (92.1%, a difference of 0.020%), Belgian (92.1%, a difference of 0.030%), Korean (92.1%, a difference of 0.030%), and Hawaiian (92.0%, a difference of 0.060%).
| Demographics | Rating | Rank | 1 or more Vehicles in Household |
| Choctaw | 99.9 /100 | #44 | Exceptional 92.2% |
| Immigrants | Nonimmigrants | 99.9 /100 | #45 | Exceptional 92.2% |
| Immigrants | Fiji | 99.9 /100 | #46 | Exceptional 92.2% |
| Northern Europeans | 99.9 /100 | #47 | Exceptional 92.2% |
| Belgians | 99.9 /100 | #48 | Exceptional 92.1% |
| Afghans | 99.9 /100 | #49 | Exceptional 92.1% |
| Guamanians/Chamorros | 99.9 /100 | #50 | Exceptional 92.1% |
| Celtics | 99.9 /100 | #51 | Exceptional 92.1% |
| Koreans | 99.9 /100 | #52 | Exceptional 92.1% |
| Hawaiians | 99.9 /100 | #53 | Exceptional 92.0% |
| Slovenes | 99.9 /100 | #54 | Exceptional 92.0% |
| Immigrants | Afghanistan | 99.9 /100 | #55 | Exceptional 92.0% |
| Immigrants | Venezuela | 99.9 /100 | #56 | Exceptional 92.0% |
| Iraqis | 99.8 /100 | #57 | Exceptional 91.9% |
| Immigrants | Mexico | 99.8 /100 | #58 | Exceptional 91.9% |
Demographics Similar to Pakistanis by 1 or more Vehicles in Household
In terms of 1 or more vehicles in household, the demographic groups most similar to Pakistanis are Potawatomi (91.3%, a difference of 0.010%), Austrian (91.3%, a difference of 0.020%), Immigrants from Cuba (91.3%, a difference of 0.030%), Immigrants from North America (91.4%, a difference of 0.090%), and Immigrants from Canada (91.4%, a difference of 0.10%).
| Demographics | Rating | Rank | 1 or more Vehicles in Household |
| Immigrants | Canada | 99.2 /100 | #90 | Exceptional 91.4% |
| Immigrants | Jordan | 99.2 /100 | #91 | Exceptional 91.4% |
| Bhutanese | 99.2 /100 | #92 | Exceptional 91.4% |
| Immigrants | North America | 99.2 /100 | #93 | Exceptional 91.4% |
| Immigrants | Cuba | 99.1 /100 | #94 | Exceptional 91.3% |
| Austrians | 99.0 /100 | #95 | Exceptional 91.3% |
| Potawatomi | 99.0 /100 | #96 | Exceptional 91.3% |
| Pakistanis | 99.0 /100 | #97 | Exceptional 91.3% |
| Slavs | 98.7 /100 | #98 | Exceptional 91.2% |
| Immigrants | Bolivia | 98.6 /100 | #99 | Exceptional 91.2% |
| Immigrants | Central America | 98.4 /100 | #100 | Exceptional 91.1% |
| Bulgarians | 98.4 /100 | #101 | Exceptional 91.1% |
| Seminole | 98.3 /100 | #102 | Exceptional 91.1% |
| Yugoslavians | 98.3 /100 | #103 | Exceptional 91.1% |
| Asians | 98.2 /100 | #104 | Exceptional 91.1% |