Swiss vs Immigrants from Thailand 1 or more Vehicles in Household
COMPARE
Swiss
Immigrants from Thailand
1 or more Vehicles in Household
1 or more Vehicles in Household Comparison
Swiss
Immigrants from Thailand
92.3%
1 OR MORE VEHICLES IN HOUSEHOLD
99.9/ 100
METRIC RATING
39th/ 347
METRIC RANK
90.6%
1 OR MORE VEHICLES IN HOUSEHOLD
92.3/ 100
METRIC RATING
120th/ 347
METRIC RANK
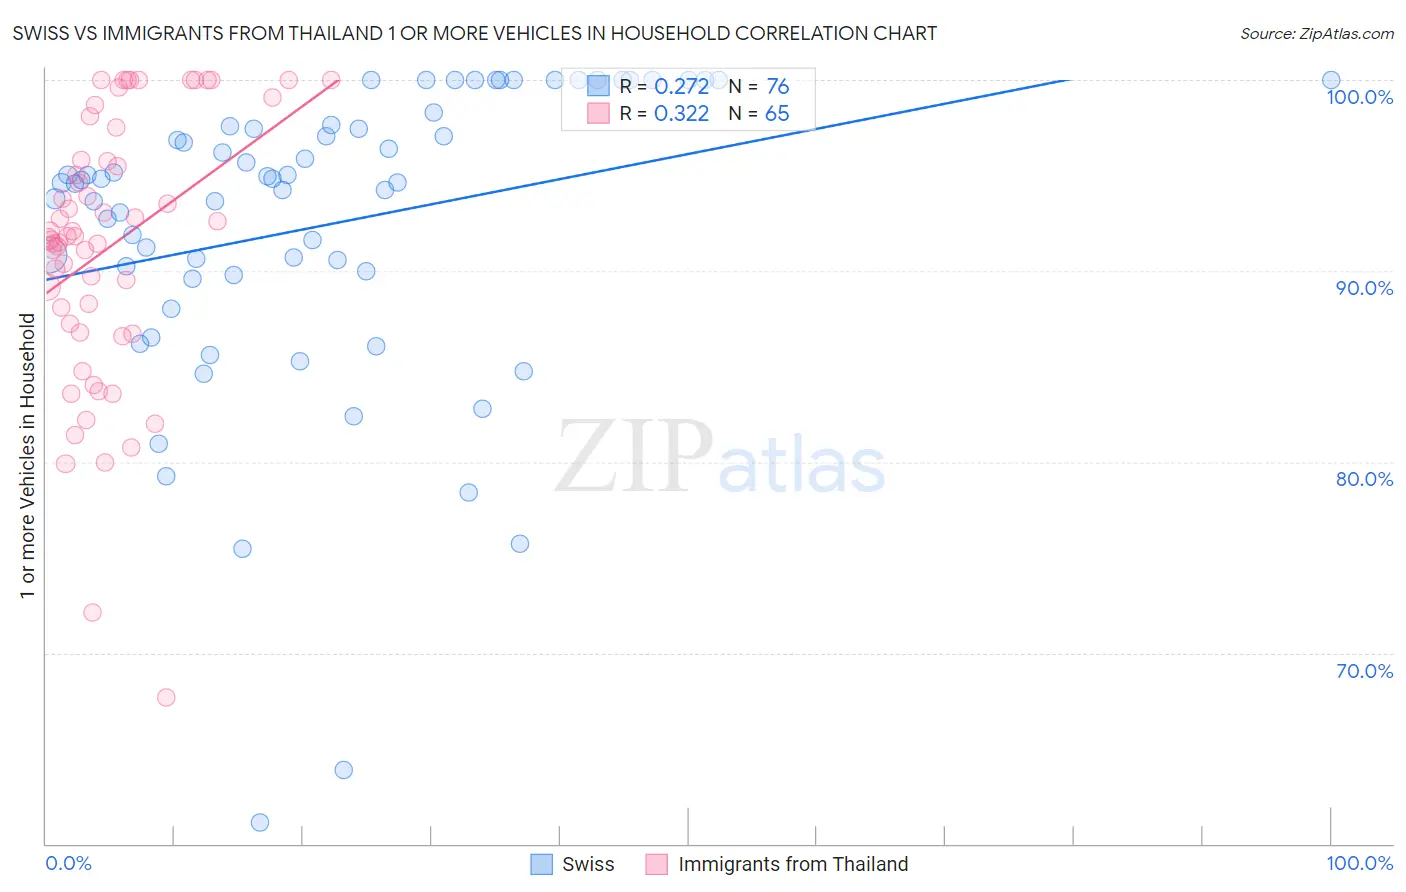
Swiss vs Immigrants from Thailand 1 or more Vehicles in Household Correlation Chart
The statistical analysis conducted on geographies consisting of 464,812,678 people shows a weak positive correlation between the proportion of Swiss and percentage of households with 1 or more vehicles available in the United States with a correlation coefficient (R) of 0.272 and weighted average of 92.3%. Similarly, the statistical analysis conducted on geographies consisting of 316,939,946 people shows a mild positive correlation between the proportion of Immigrants from Thailand and percentage of households with 1 or more vehicles available in the United States with a correlation coefficient (R) of 0.322 and weighted average of 90.6%, a difference of 1.9%.
1 or more Vehicles in Household Correlation Summary
| Measurement | Swiss | Immigrants from Thailand |
| Minimum | 61.1% | 67.6% |
| Maximum | 100.0% | 100.0% |
| Range | 38.9% | 32.4% |
| Mean | 92.4% | 91.3% |
| Median | 94.7% | 91.8% |
| Interquartile 25% (IQ1) | 89.9% | 87.0% |
| Interquartile 75% (IQ3) | 97.6% | 96.7% |
| Interquartile Range (IQR) | 7.7% | 9.6% |
| Standard Deviation (Sample) | 8.0% | 7.0% |
| Standard Deviation (Population) | 7.9% | 7.0% |
Similar Demographics by 1 or more Vehicles in Household
Demographics Similar to Swiss by 1 or more Vehicles in Household
In terms of 1 or more vehicles in household, the demographic groups most similar to Swiss are Creek (92.3%, a difference of 0.0%), French Canadian (92.3%, a difference of 0.010%), Immigrants from Vietnam (92.3%, a difference of 0.010%), Czechoslovakian (92.3%, a difference of 0.020%), and Malaysian (92.3%, a difference of 0.020%).
| Demographics | Rating | Rank | 1 or more Vehicles in Household |
| Basques | 100.0 /100 | #32 | Exceptional 92.4% |
| Cherokee | 100.0 /100 | #33 | Exceptional 92.4% |
| Italians | 99.9 /100 | #34 | Exceptional 92.3% |
| Czechoslovakians | 99.9 /100 | #35 | Exceptional 92.3% |
| Malaysians | 99.9 /100 | #36 | Exceptional 92.3% |
| French Canadians | 99.9 /100 | #37 | Exceptional 92.3% |
| Immigrants | Vietnam | 99.9 /100 | #38 | Exceptional 92.3% |
| Swiss | 99.9 /100 | #39 | Exceptional 92.3% |
| Creek | 99.9 /100 | #40 | Exceptional 92.3% |
| Immigrants | Taiwan | 99.9 /100 | #41 | Exceptional 92.3% |
| Chickasaw | 99.9 /100 | #42 | Exceptional 92.3% |
| Spanish | 99.9 /100 | #43 | Exceptional 92.3% |
| Choctaw | 99.9 /100 | #44 | Exceptional 92.2% |
| Immigrants | Nonimmigrants | 99.9 /100 | #45 | Exceptional 92.2% |
| Immigrants | Fiji | 99.9 /100 | #46 | Exceptional 92.2% |
Demographics Similar to Immigrants from Thailand by 1 or more Vehicles in Household
In terms of 1 or more vehicles in household, the demographic groups most similar to Immigrants from Thailand are Icelander (90.5%, a difference of 0.010%), Blackfeet (90.6%, a difference of 0.020%), Costa Rican (90.5%, a difference of 0.020%), Fijian (90.5%, a difference of 0.020%), and Puget Sound Salish (90.5%, a difference of 0.040%).
| Demographics | Rating | Rank | 1 or more Vehicles in Household |
| Immigrants | Kuwait | 94.7 /100 | #113 | Exceptional 90.7% |
| Armenians | 94.5 /100 | #114 | Exceptional 90.7% |
| Serbians | 94.3 /100 | #115 | Exceptional 90.7% |
| Chippewa | 94.3 /100 | #116 | Exceptional 90.7% |
| Greeks | 93.5 /100 | #117 | Exceptional 90.6% |
| Japanese | 93.4 /100 | #118 | Exceptional 90.6% |
| Blackfeet | 92.6 /100 | #119 | Exceptional 90.6% |
| Immigrants | Thailand | 92.3 /100 | #120 | Exceptional 90.6% |
| Icelanders | 92.1 /100 | #121 | Exceptional 90.5% |
| Costa Ricans | 92.0 /100 | #122 | Exceptional 90.5% |
| Fijians | 91.8 /100 | #123 | Exceptional 90.5% |
| Puget Sound Salish | 91.5 /100 | #124 | Exceptional 90.5% |
| Immigrants | Korea | 90.5 /100 | #125 | Exceptional 90.5% |
| Immigrants | Cameroon | 89.4 /100 | #126 | Excellent 90.4% |
| Immigrants | Azores | 89.1 /100 | #127 | Excellent 90.4% |