Celtic vs Immigrants from Costa Rica 1 or more Vehicles in Household
COMPARE
Celtic
Immigrants from Costa Rica
1 or more Vehicles in Household
1 or more Vehicles in Household Comparison
Celtics
Immigrants from Costa Rica
92.1%
1 OR MORE VEHICLES IN HOUSEHOLD
99.9/ 100
METRIC RATING
51st/ 347
METRIC RANK
89.8%
1 OR MORE VEHICLES IN HOUSEHOLD
57.6/ 100
METRIC RATING
170th/ 347
METRIC RANK
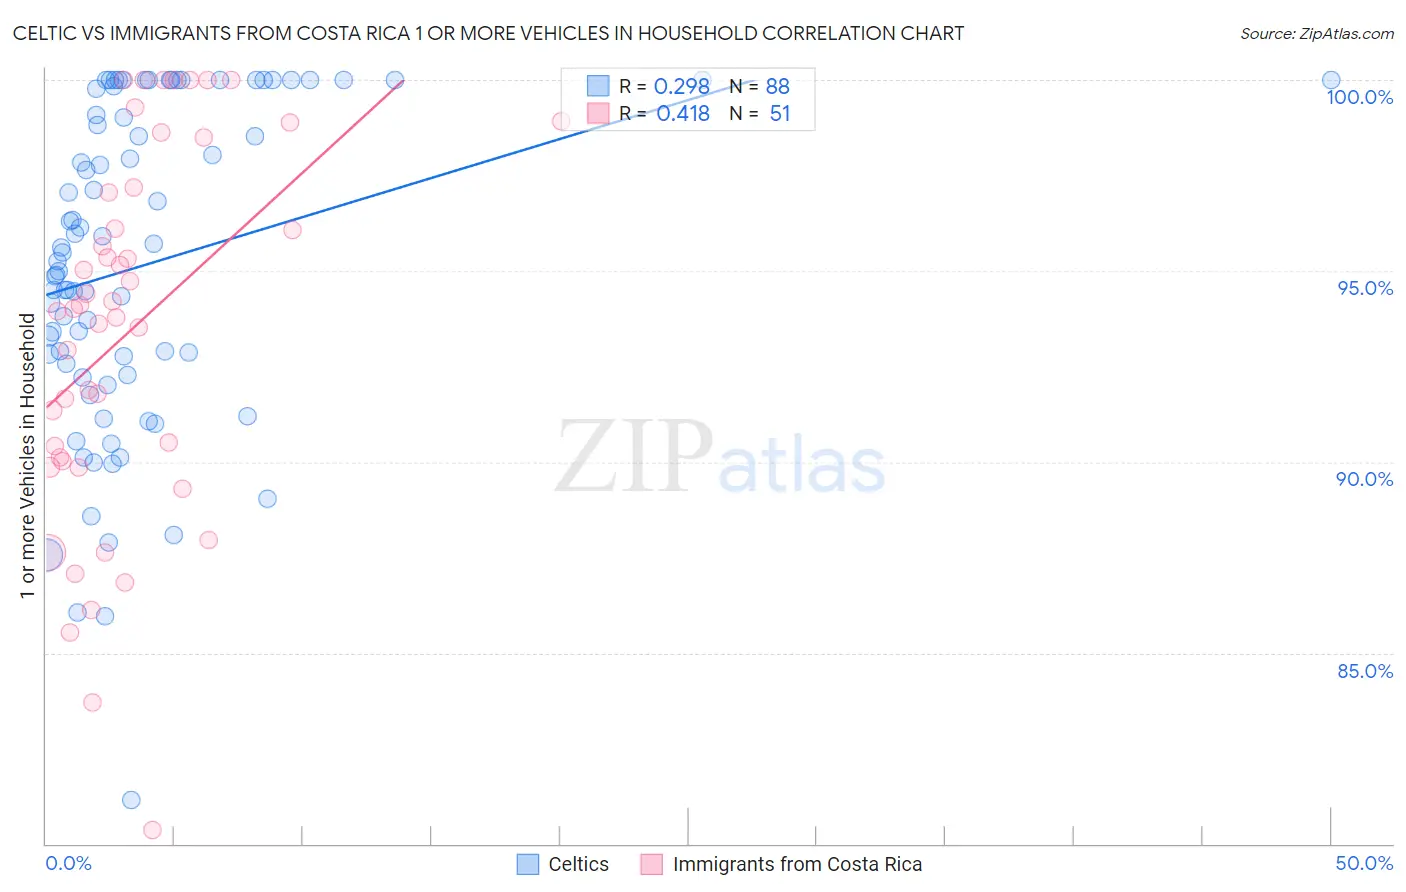
Celtic vs Immigrants from Costa Rica 1 or more Vehicles in Household Correlation Chart
The statistical analysis conducted on geographies consisting of 168,861,273 people shows a weak positive correlation between the proportion of Celtics and percentage of households with 1 or more vehicles available in the United States with a correlation coefficient (R) of 0.298 and weighted average of 92.1%. Similarly, the statistical analysis conducted on geographies consisting of 204,257,602 people shows a moderate positive correlation between the proportion of Immigrants from Costa Rica and percentage of households with 1 or more vehicles available in the United States with a correlation coefficient (R) of 0.418 and weighted average of 89.8%, a difference of 2.5%.
1 or more Vehicles in Household Correlation Summary
| Measurement | Celtic | Immigrants from Costa Rica |
| Minimum | 81.1% | 80.3% |
| Maximum | 100.0% | 100.0% |
| Range | 18.9% | 19.7% |
| Mean | 95.2% | 93.4% |
| Median | 95.4% | 94.0% |
| Interquartile 25% (IQ1) | 92.4% | 90.0% |
| Interquartile 75% (IQ3) | 99.8% | 97.2% |
| Interquartile Range (IQR) | 7.4% | 7.2% |
| Standard Deviation (Sample) | 4.2% | 4.8% |
| Standard Deviation (Population) | 4.2% | 4.8% |
Similar Demographics by 1 or more Vehicles in Household
Demographics Similar to Celtics by 1 or more Vehicles in Household
In terms of 1 or more vehicles in household, the demographic groups most similar to Celtics are Guamanian/Chamorro (92.1%, a difference of 0.010%), Afghan (92.1%, a difference of 0.020%), Belgian (92.1%, a difference of 0.030%), Korean (92.1%, a difference of 0.030%), and Hawaiian (92.0%, a difference of 0.060%).
| Demographics | Rating | Rank | 1 or more Vehicles in Household |
| Choctaw | 99.9 /100 | #44 | Exceptional 92.2% |
| Immigrants | Nonimmigrants | 99.9 /100 | #45 | Exceptional 92.2% |
| Immigrants | Fiji | 99.9 /100 | #46 | Exceptional 92.2% |
| Northern Europeans | 99.9 /100 | #47 | Exceptional 92.2% |
| Belgians | 99.9 /100 | #48 | Exceptional 92.1% |
| Afghans | 99.9 /100 | #49 | Exceptional 92.1% |
| Guamanians/Chamorros | 99.9 /100 | #50 | Exceptional 92.1% |
| Celtics | 99.9 /100 | #51 | Exceptional 92.1% |
| Koreans | 99.9 /100 | #52 | Exceptional 92.1% |
| Hawaiians | 99.9 /100 | #53 | Exceptional 92.0% |
| Slovenes | 99.9 /100 | #54 | Exceptional 92.0% |
| Immigrants | Afghanistan | 99.9 /100 | #55 | Exceptional 92.0% |
| Immigrants | Venezuela | 99.9 /100 | #56 | Exceptional 92.0% |
| Iraqis | 99.8 /100 | #57 | Exceptional 91.9% |
| Immigrants | Mexico | 99.8 /100 | #58 | Exceptional 91.9% |
Demographics Similar to Immigrants from Costa Rica by 1 or more Vehicles in Household
In terms of 1 or more vehicles in household, the demographic groups most similar to Immigrants from Costa Rica are Native/Alaskan (89.8%, a difference of 0.030%), Immigrants from Latin America (89.8%, a difference of 0.040%), Immigrants from Cambodia (89.8%, a difference of 0.040%), French American Indian (89.8%, a difference of 0.050%), and Indonesian (89.7%, a difference of 0.070%).
| Demographics | Rating | Rank | 1 or more Vehicles in Household |
| Immigrants | Austria | 65.5 /100 | #163 | Good 89.9% |
| Comanche | 63.4 /100 | #164 | Good 89.9% |
| Immigrants | Saudi Arabia | 62.6 /100 | #165 | Good 89.9% |
| Immigrants | Middle Africa | 62.2 /100 | #166 | Good 89.9% |
| Immigrants | Latin America | 60.3 /100 | #167 | Good 89.8% |
| Immigrants | Cambodia | 60.1 /100 | #168 | Good 89.8% |
| Natives/Alaskans | 59.5 /100 | #169 | Average 89.8% |
| Immigrants | Costa Rica | 57.6 /100 | #170 | Average 89.8% |
| French American Indians | 54.4 /100 | #171 | Average 89.8% |
| Indonesians | 53.0 /100 | #172 | Average 89.7% |
| Lumbee | 52.8 /100 | #173 | Average 89.7% |
| Filipinos | 50.0 /100 | #174 | Average 89.7% |
| Immigrants | Burma/Myanmar | 47.6 /100 | #175 | Average 89.7% |
| Immigrants | Sudan | 47.1 /100 | #176 | Average 89.7% |
| Hmong | 45.8 /100 | #177 | Average 89.6% |