Native Hawaiian vs Immigrants from Thailand 1 or more Vehicles in Household
COMPARE
Native Hawaiian
Immigrants from Thailand
1 or more Vehicles in Household
1 or more Vehicles in Household Comparison
Native Hawaiians
Immigrants from Thailand
92.4%
1 OR MORE VEHICLES IN HOUSEHOLD
100.0/ 100
METRIC RATING
29th/ 347
METRIC RANK
90.6%
1 OR MORE VEHICLES IN HOUSEHOLD
92.3/ 100
METRIC RATING
120th/ 347
METRIC RANK
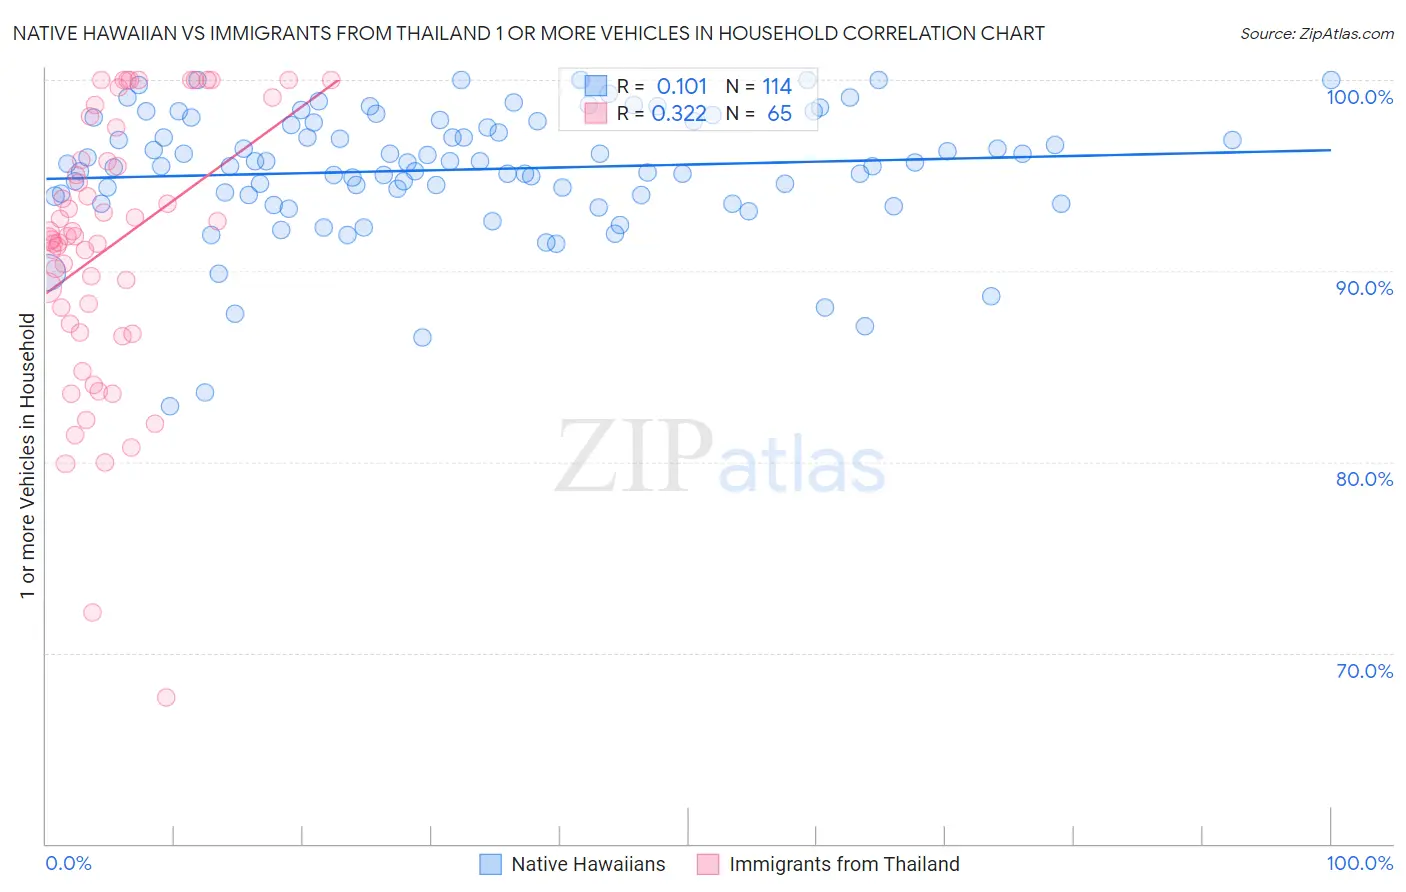
Native Hawaiian vs Immigrants from Thailand 1 or more Vehicles in Household Correlation Chart
The statistical analysis conducted on geographies consisting of 331,859,591 people shows a poor positive correlation between the proportion of Native Hawaiians and percentage of households with 1 or more vehicles available in the United States with a correlation coefficient (R) of 0.101 and weighted average of 92.4%. Similarly, the statistical analysis conducted on geographies consisting of 316,939,946 people shows a mild positive correlation between the proportion of Immigrants from Thailand and percentage of households with 1 or more vehicles available in the United States with a correlation coefficient (R) of 0.322 and weighted average of 90.6%, a difference of 2.1%.
1 or more Vehicles in Household Correlation Summary
| Measurement | Native Hawaiian | Immigrants from Thailand |
| Minimum | 82.9% | 67.6% |
| Maximum | 100.0% | 100.0% |
| Range | 17.1% | 32.4% |
| Mean | 95.3% | 91.3% |
| Median | 95.6% | 91.8% |
| Interquartile 25% (IQ1) | 93.9% | 87.0% |
| Interquartile 75% (IQ3) | 97.8% | 96.7% |
| Interquartile Range (IQR) | 3.9% | 9.6% |
| Standard Deviation (Sample) | 3.3% | 7.0% |
| Standard Deviation (Population) | 3.3% | 7.0% |
Similar Demographics by 1 or more Vehicles in Household
Demographics Similar to Native Hawaiians by 1 or more Vehicles in Household
In terms of 1 or more vehicles in household, the demographic groups most similar to Native Hawaiians are Finnish (92.4%, a difference of 0.0%), Sri Lankan (92.5%, a difference of 0.010%), Samoan (92.4%, a difference of 0.010%), American (92.5%, a difference of 0.050%), and Basque (92.4%, a difference of 0.050%).
| Demographics | Rating | Rank | 1 or more Vehicles in Household |
| French | 100.0 /100 | #22 | Exceptional 92.7% |
| Nepalese | 100.0 /100 | #23 | Exceptional 92.6% |
| Yaqui | 100.0 /100 | #24 | Exceptional 92.6% |
| Immigrants | Iraq | 100.0 /100 | #25 | Exceptional 92.5% |
| British | 100.0 /100 | #26 | Exceptional 92.5% |
| Americans | 100.0 /100 | #27 | Exceptional 92.5% |
| Sri Lankans | 100.0 /100 | #28 | Exceptional 92.5% |
| Native Hawaiians | 100.0 /100 | #29 | Exceptional 92.4% |
| Finns | 100.0 /100 | #30 | Exceptional 92.4% |
| Samoans | 100.0 /100 | #31 | Exceptional 92.4% |
| Basques | 100.0 /100 | #32 | Exceptional 92.4% |
| Cherokee | 100.0 /100 | #33 | Exceptional 92.4% |
| Italians | 99.9 /100 | #34 | Exceptional 92.3% |
| Czechoslovakians | 99.9 /100 | #35 | Exceptional 92.3% |
| Malaysians | 99.9 /100 | #36 | Exceptional 92.3% |
Demographics Similar to Immigrants from Thailand by 1 or more Vehicles in Household
In terms of 1 or more vehicles in household, the demographic groups most similar to Immigrants from Thailand are Icelander (90.5%, a difference of 0.010%), Blackfeet (90.6%, a difference of 0.020%), Costa Rican (90.5%, a difference of 0.020%), Fijian (90.5%, a difference of 0.020%), and Puget Sound Salish (90.5%, a difference of 0.040%).
| Demographics | Rating | Rank | 1 or more Vehicles in Household |
| Immigrants | Kuwait | 94.7 /100 | #113 | Exceptional 90.7% |
| Armenians | 94.5 /100 | #114 | Exceptional 90.7% |
| Serbians | 94.3 /100 | #115 | Exceptional 90.7% |
| Chippewa | 94.3 /100 | #116 | Exceptional 90.7% |
| Greeks | 93.5 /100 | #117 | Exceptional 90.6% |
| Japanese | 93.4 /100 | #118 | Exceptional 90.6% |
| Blackfeet | 92.6 /100 | #119 | Exceptional 90.6% |
| Immigrants | Thailand | 92.3 /100 | #120 | Exceptional 90.6% |
| Icelanders | 92.1 /100 | #121 | Exceptional 90.5% |
| Costa Ricans | 92.0 /100 | #122 | Exceptional 90.5% |
| Fijians | 91.8 /100 | #123 | Exceptional 90.5% |
| Puget Sound Salish | 91.5 /100 | #124 | Exceptional 90.5% |
| Immigrants | Korea | 90.5 /100 | #125 | Exceptional 90.5% |
| Immigrants | Cameroon | 89.4 /100 | #126 | Excellent 90.4% |
| Immigrants | Azores | 89.1 /100 | #127 | Excellent 90.4% |