Lumbee vs Immigrants from Egypt 4 or more Vehicles in Household
COMPARE
Lumbee
Immigrants from Egypt
4 or more Vehicles in Household
4 or more Vehicles in Household Comparison
Lumbee
Immigrants from Egypt
8.8%
4 OR MORE VEHICLES IN HOUSEHOLD
100.0/ 100
METRIC RATING
16th/ 347
METRIC RANK
6.0%
4 OR MORE VEHICLES IN HOUSEHOLD
14.7/ 100
METRIC RATING
212th/ 347
METRIC RANK
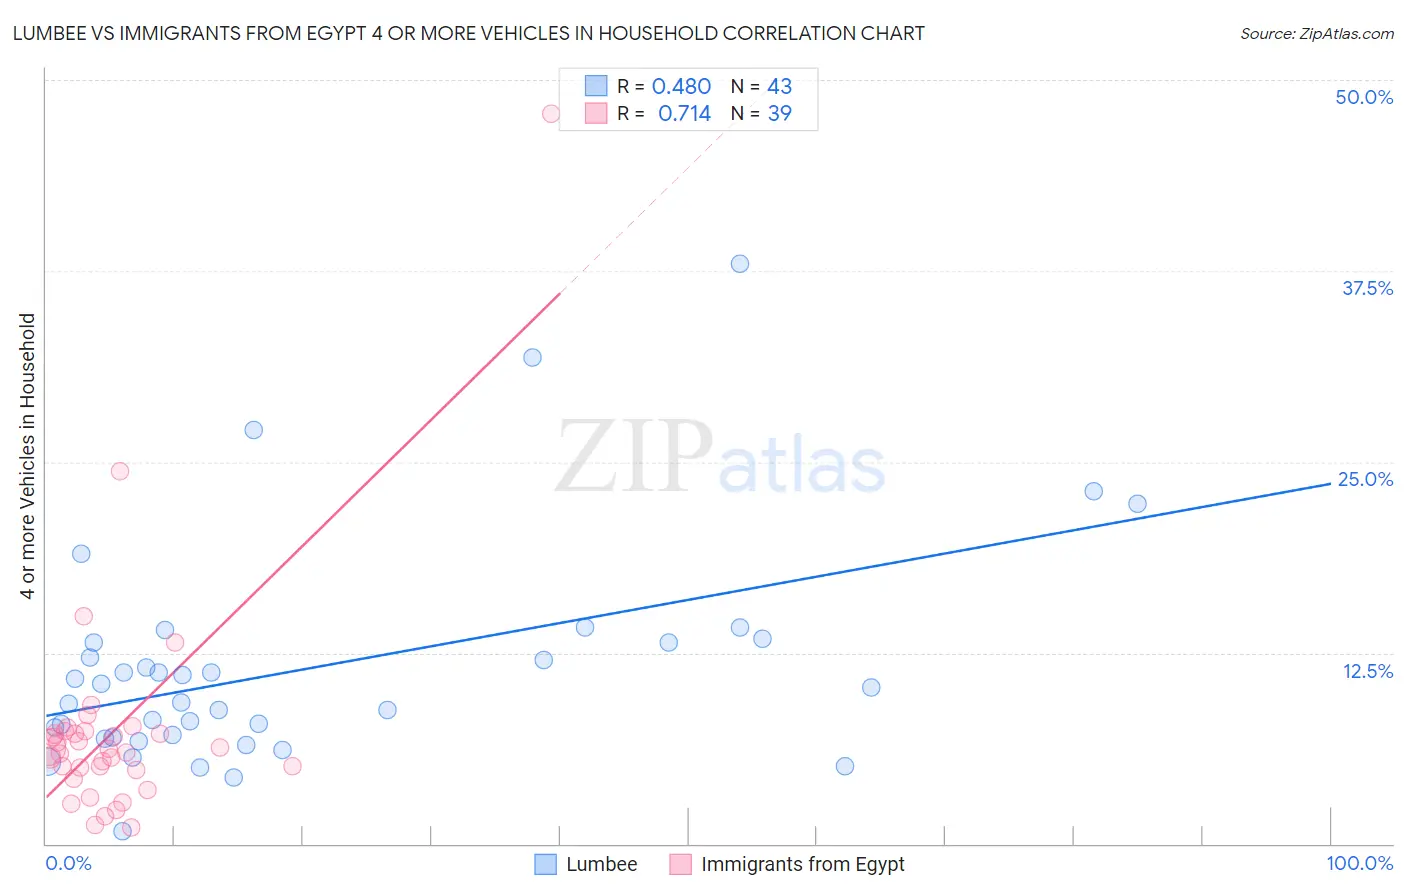
Lumbee vs Immigrants from Egypt 4 or more Vehicles in Household Correlation Chart
The statistical analysis conducted on geographies consisting of 92,195,503 people shows a moderate positive correlation between the proportion of Lumbee and percentage of households with 4 or more vehicles available in the United States with a correlation coefficient (R) of 0.480 and weighted average of 8.8%. Similarly, the statistical analysis conducted on geographies consisting of 244,625,690 people shows a strong positive correlation between the proportion of Immigrants from Egypt and percentage of households with 4 or more vehicles available in the United States with a correlation coefficient (R) of 0.714 and weighted average of 6.0%, a difference of 45.3%.
4 or more Vehicles in Household Correlation Summary
| Measurement | Lumbee | Immigrants from Egypt |
| Minimum | 0.79% | 1.1% |
| Maximum | 38.0% | 47.8% |
| Range | 37.2% | 46.7% |
| Mean | 11.6% | 7.5% |
| Median | 10.3% | 6.2% |
| Interquartile 25% (IQ1) | 7.0% | 4.8% |
| Interquartile 75% (IQ3) | 13.2% | 7.3% |
| Interquartile Range (IQR) | 6.2% | 2.5% |
| Standard Deviation (Sample) | 7.3% | 7.8% |
| Standard Deviation (Population) | 7.2% | 7.7% |
Similar Demographics by 4 or more Vehicles in Household
Demographics Similar to Lumbee by 4 or more Vehicles in Household
In terms of 4 or more vehicles in household, the demographic groups most similar to Lumbee are Ute (8.8%, a difference of 0.33%), Nepalese (8.7%, a difference of 0.43%), Shoshone (8.8%, a difference of 0.71%), Chinese (8.8%, a difference of 0.74%), and Korean (8.6%, a difference of 1.6%).
| Demographics | Rating | Rank | 4 or more Vehicles in Household |
| Samoans | 100.0 /100 | #9 | Exceptional 9.2% |
| Paiute | 100.0 /100 | #10 | Exceptional 9.0% |
| Immigrants | Mexico | 100.0 /100 | #11 | Exceptional 9.0% |
| Mexicans | 100.0 /100 | #12 | Exceptional 8.9% |
| Hawaiians | 100.0 /100 | #13 | Exceptional 8.9% |
| Chinese | 100.0 /100 | #14 | Exceptional 8.8% |
| Shoshone | 100.0 /100 | #15 | Exceptional 8.8% |
| Lumbee | 100.0 /100 | #16 | Exceptional 8.8% |
| Ute | 100.0 /100 | #17 | Exceptional 8.8% |
| Nepalese | 100.0 /100 | #18 | Exceptional 8.7% |
| Koreans | 100.0 /100 | #19 | Exceptional 8.6% |
| Pueblo | 100.0 /100 | #20 | Exceptional 8.6% |
| Danes | 100.0 /100 | #21 | Exceptional 8.6% |
| Immigrants | Vietnam | 100.0 /100 | #22 | Exceptional 8.6% |
| Immigrants | Philippines | 100.0 /100 | #23 | Exceptional 8.5% |
Demographics Similar to Immigrants from Egypt by 4 or more Vehicles in Household
In terms of 4 or more vehicles in household, the demographic groups most similar to Immigrants from Egypt are Panamanian (6.0%, a difference of 0.020%), Arab (6.0%, a difference of 0.060%), Immigrants from Austria (6.0%, a difference of 0.080%), Immigrants from Zimbabwe (6.0%, a difference of 0.10%), and Immigrants from Honduras (6.1%, a difference of 0.15%).
| Demographics | Rating | Rank | 4 or more Vehicles in Household |
| Hondurans | 19.3 /100 | #205 | Poor 6.1% |
| Kenyans | 18.5 /100 | #206 | Poor 6.1% |
| Immigrants | Chile | 16.9 /100 | #207 | Poor 6.1% |
| Immigrants | Nigeria | 15.6 /100 | #208 | Poor 6.1% |
| Immigrants | Honduras | 15.4 /100 | #209 | Poor 6.1% |
| Immigrants | Zimbabwe | 15.1 /100 | #210 | Poor 6.0% |
| Panamanians | 14.8 /100 | #211 | Poor 6.0% |
| Immigrants | Egypt | 14.7 /100 | #212 | Poor 6.0% |
| Arabs | 14.4 /100 | #213 | Poor 6.0% |
| Immigrants | Austria | 14.3 /100 | #214 | Poor 6.0% |
| Immigrants | China | 13.8 /100 | #215 | Poor 6.0% |
| Immigrants | Romania | 13.8 /100 | #216 | Poor 6.0% |
| Nigerians | 12.2 /100 | #217 | Poor 6.0% |
| Immigrants | Italy | 11.0 /100 | #218 | Poor 6.0% |
| Serbians | 11.0 /100 | #219 | Poor 6.0% |