Cambodian vs Immigrants from Egypt 2 or more Vehicles in Household
COMPARE
Cambodian
Immigrants from Egypt
2 or more Vehicles in Household
2 or more Vehicles in Household Comparison
Cambodians
Immigrants from Egypt
53.3%
2 OR MORE VEHICLES IN HOUSEHOLD
2.3/ 100
METRIC RATING
239th/ 347
METRIC RANK
53.8%
2 OR MORE VEHICLES IN HOUSEHOLD
5.2/ 100
METRIC RATING
225th/ 347
METRIC RANK
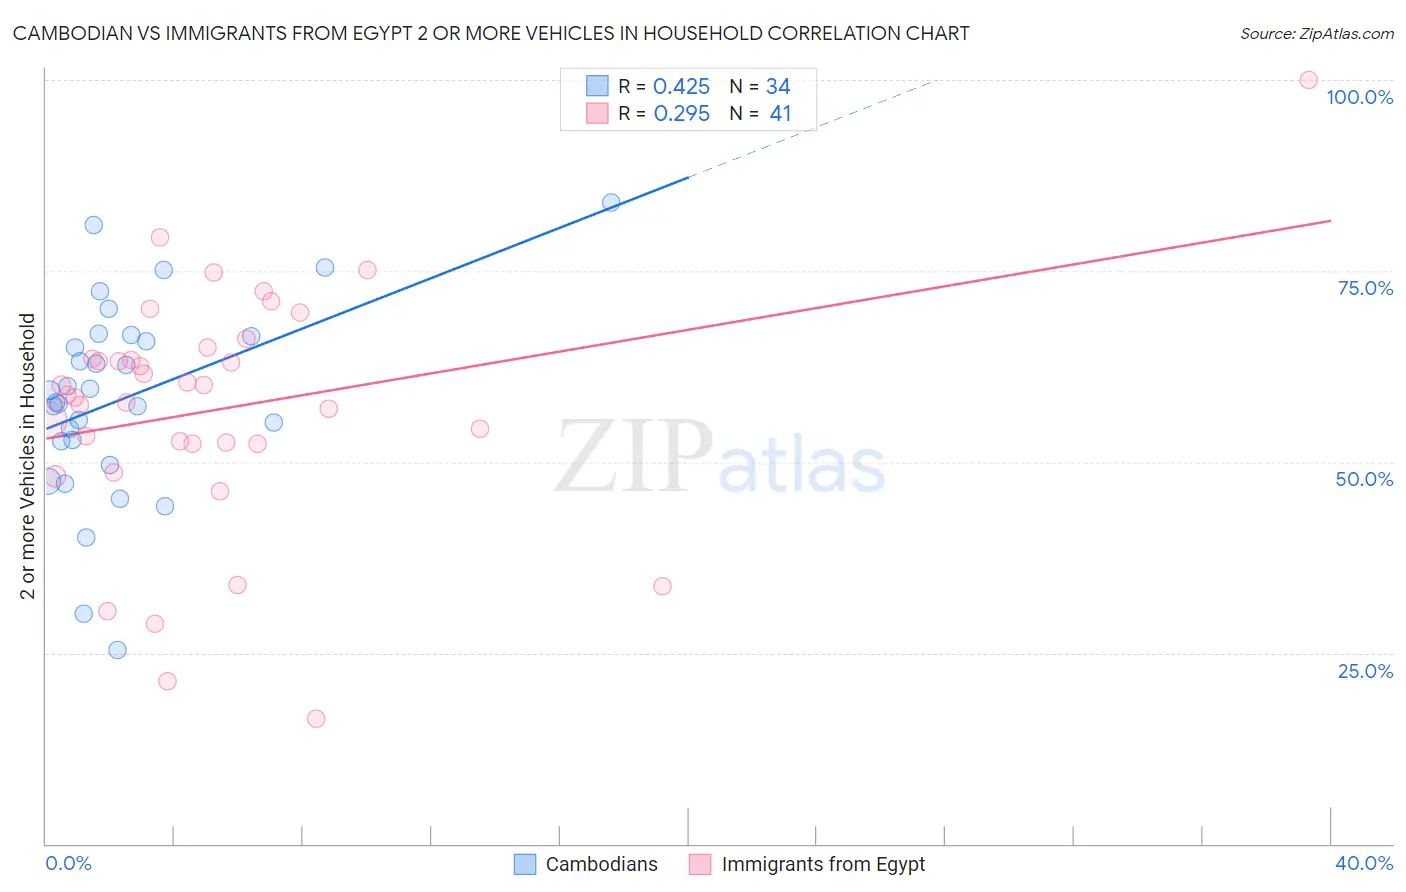
Cambodian vs Immigrants from Egypt 2 or more Vehicles in Household Correlation Chart
The statistical analysis conducted on geographies consisting of 102,491,174 people shows a moderate positive correlation between the proportion of Cambodians and percentage of households with 2 or more vehicles available in the United States with a correlation coefficient (R) of 0.425 and weighted average of 53.3%. Similarly, the statistical analysis conducted on geographies consisting of 245,432,298 people shows a weak positive correlation between the proportion of Immigrants from Egypt and percentage of households with 2 or more vehicles available in the United States with a correlation coefficient (R) of 0.295 and weighted average of 53.8%, a difference of 0.90%.
2 or more Vehicles in Household Correlation Summary
| Measurement | Cambodian | Immigrants from Egypt |
| Minimum | 25.3% | 16.3% |
| Maximum | 83.9% | 100.0% |
| Range | 58.6% | 83.7% |
| Mean | 58.4% | 56.9% |
| Median | 58.6% | 58.8% |
| Interquartile 25% (IQ1) | 52.7% | 52.4% |
| Interquartile 75% (IQ3) | 66.4% | 64.2% |
| Interquartile Range (IQR) | 13.8% | 11.8% |
| Standard Deviation (Sample) | 12.9% | 15.9% |
| Standard Deviation (Population) | 12.7% | 15.7% |
Demographics Similar to Cambodians and Immigrants from Egypt by 2 or more Vehicles in Household
In terms of 2 or more vehicles in household, the demographic groups most similar to Cambodians are Immigrants from Armenia (53.3%, a difference of 0.010%), Macedonian (53.3%, a difference of 0.070%), Immigrants from Europe (53.2%, a difference of 0.070%), Immigrants from Sierra Leone (53.2%, a difference of 0.10%), and Immigrants from Eastern Asia (53.2%, a difference of 0.10%). Similarly, the demographic groups most similar to Immigrants from Egypt are Brazilian (53.8%, a difference of 0.010%), Immigrants from Eastern Africa (53.7%, a difference of 0.020%), Immigrants from Bosnia and Herzegovina (53.8%, a difference of 0.050%), Kiowa (53.9%, a difference of 0.18%), and Sudanese (53.6%, a difference of 0.25%).
| Demographics | Rating | Rank | 2 or more Vehicles in Household |
| Kiowa | 6.2 /100 | #222 | Tragic 53.9% |
| Immigrants | Bosnia and Herzegovina | 5.5 /100 | #223 | Tragic 53.8% |
| Brazilians | 5.3 /100 | #224 | Tragic 53.8% |
| Immigrants | Egypt | 5.2 /100 | #225 | Tragic 53.8% |
| Immigrants | Eastern Africa | 5.1 /100 | #226 | Tragic 53.7% |
| Sudanese | 4.1 /100 | #227 | Tragic 53.6% |
| Alaska Natives | 3.9 /100 | #228 | Tragic 53.6% |
| Immigrants | Turkey | 3.8 /100 | #229 | Tragic 53.6% |
| Immigrants | Nepal | 3.6 /100 | #230 | Tragic 53.5% |
| Panamanians | 3.4 /100 | #231 | Tragic 53.5% |
| Immigrants | Guatemala | 3.2 /100 | #232 | Tragic 53.5% |
| Ugandans | 3.2 /100 | #233 | Tragic 53.5% |
| Immigrants | Switzerland | 3.0 /100 | #234 | Tragic 53.4% |
| Immigrants | Middle Africa | 3.0 /100 | #235 | Tragic 53.4% |
| Indonesians | 2.7 /100 | #236 | Tragic 53.4% |
| Macedonians | 2.4 /100 | #237 | Tragic 53.3% |
| Immigrants | Armenia | 2.3 /100 | #238 | Tragic 53.3% |
| Cambodians | 2.3 /100 | #239 | Tragic 53.3% |
| Immigrants | Europe | 2.1 /100 | #240 | Tragic 53.2% |
| Immigrants | Sierra Leone | 2.1 /100 | #241 | Tragic 53.2% |
| Immigrants | Eastern Asia | 2.1 /100 | #242 | Tragic 53.2% |