Immigrants from Trinidad and Tobago vs Immigrants from Egypt 2 or more Vehicles in Household
COMPARE
Immigrants from Trinidad and Tobago
Immigrants from Egypt
2 or more Vehicles in Household
2 or more Vehicles in Household Comparison
Immigrants from Trinidad and Tobago
Immigrants from Egypt
40.3%
2 OR MORE VEHICLES IN HOUSEHOLD
0.0/ 100
METRIC RATING
334th/ 347
METRIC RANK
53.8%
2 OR MORE VEHICLES IN HOUSEHOLD
5.2/ 100
METRIC RATING
225th/ 347
METRIC RANK
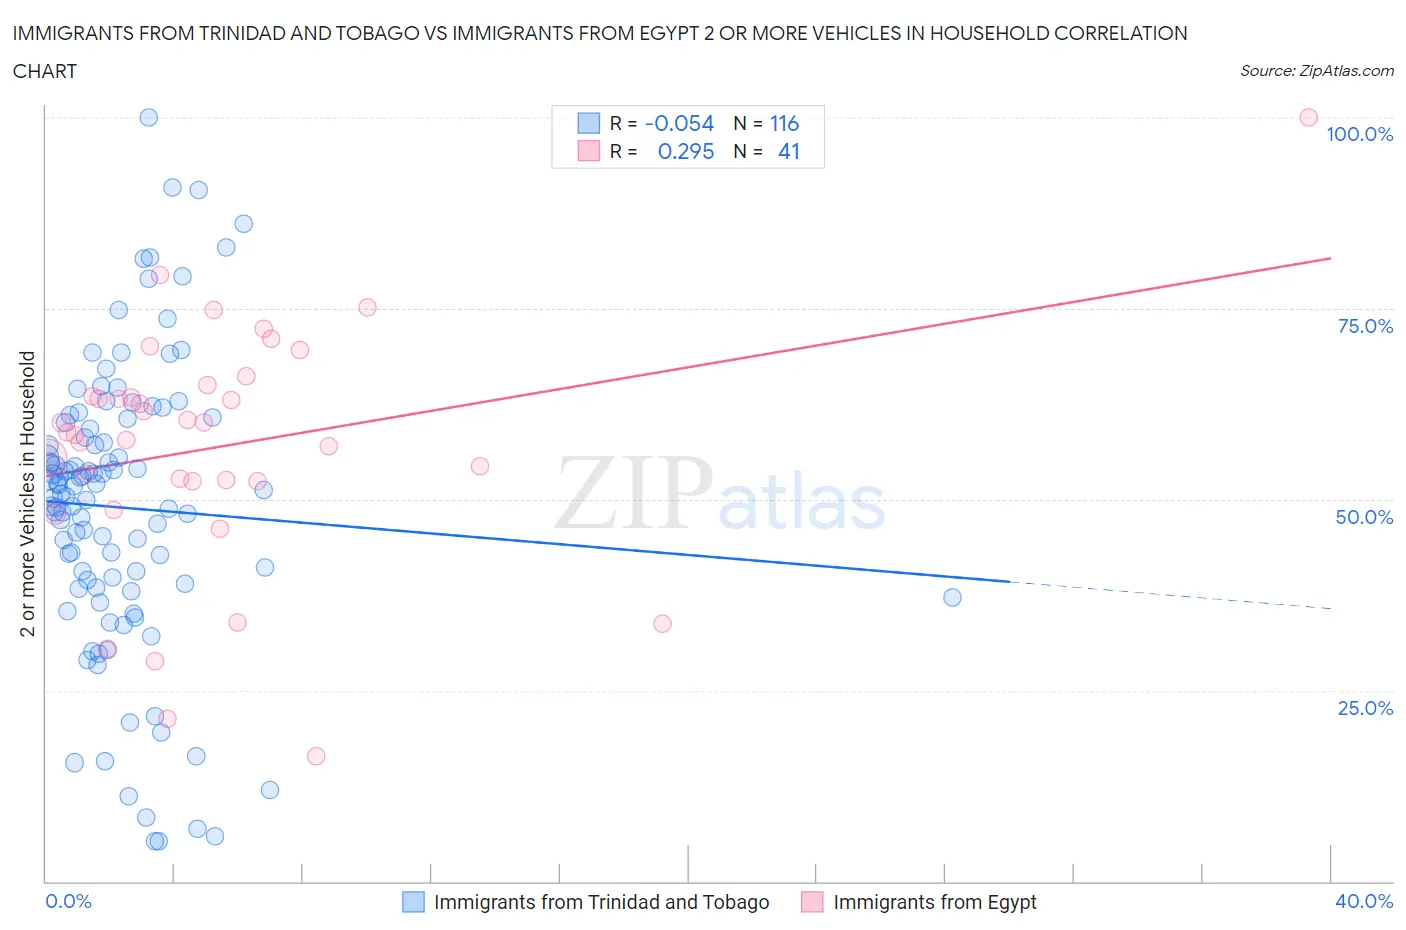
Immigrants from Trinidad and Tobago vs Immigrants from Egypt 2 or more Vehicles in Household Correlation Chart
The statistical analysis conducted on geographies consisting of 223,484,323 people shows a slight negative correlation between the proportion of Immigrants from Trinidad and Tobago and percentage of households with 2 or more vehicles available in the United States with a correlation coefficient (R) of -0.054 and weighted average of 40.3%. Similarly, the statistical analysis conducted on geographies consisting of 245,432,298 people shows a weak positive correlation between the proportion of Immigrants from Egypt and percentage of households with 2 or more vehicles available in the United States with a correlation coefficient (R) of 0.295 and weighted average of 53.8%, a difference of 33.5%.
2 or more Vehicles in Household Correlation Summary
| Measurement | Immigrants from Trinidad and Tobago | Immigrants from Egypt |
| Minimum | 5.2% | 16.3% |
| Maximum | 100.0% | 100.0% |
| Range | 94.8% | 83.7% |
| Mean | 48.9% | 56.9% |
| Median | 50.9% | 58.8% |
| Interquartile 25% (IQ1) | 38.7% | 52.4% |
| Interquartile 75% (IQ3) | 59.7% | 64.2% |
| Interquartile Range (IQR) | 20.9% | 11.8% |
| Standard Deviation (Sample) | 18.9% | 15.9% |
| Standard Deviation (Population) | 18.9% | 15.7% |
Similar Demographics by 2 or more Vehicles in Household
Demographics Similar to Immigrants from Trinidad and Tobago by 2 or more Vehicles in Household
In terms of 2 or more vehicles in household, the demographic groups most similar to Immigrants from Trinidad and Tobago are Immigrants from Ecuador (40.5%, a difference of 0.58%), Trinidadian and Tobagonian (40.9%, a difference of 1.5%), West Indian (41.3%, a difference of 2.5%), Immigrants from Dominica (41.6%, a difference of 3.4%), and Immigrants from Bangladesh (38.8%, a difference of 3.9%).
| Demographics | Rating | Rank | 2 or more Vehicles in Household |
| Immigrants | Yemen | 0.0 /100 | #327 | Tragic 42.8% |
| Inupiat | 0.0 /100 | #328 | Tragic 42.6% |
| Ecuadorians | 0.0 /100 | #329 | Tragic 42.0% |
| Immigrants | Dominica | 0.0 /100 | #330 | Tragic 41.6% |
| West Indians | 0.0 /100 | #331 | Tragic 41.3% |
| Trinidadians and Tobagonians | 0.0 /100 | #332 | Tragic 40.9% |
| Immigrants | Ecuador | 0.0 /100 | #333 | Tragic 40.5% |
| Immigrants | Trinidad and Tobago | 0.0 /100 | #334 | Tragic 40.3% |
| Immigrants | Bangladesh | 0.0 /100 | #335 | Tragic 38.8% |
| Vietnamese | 0.0 /100 | #336 | Tragic 38.5% |
| Barbadians | 0.0 /100 | #337 | Tragic 38.3% |
| Immigrants | Uzbekistan | 0.0 /100 | #338 | Tragic 37.9% |
| Immigrants | Barbados | 0.0 /100 | #339 | Tragic 35.8% |
| British West Indians | 0.0 /100 | #340 | Tragic 35.4% |
| Guyanese | 0.0 /100 | #341 | Tragic 35.4% |
Demographics Similar to Immigrants from Egypt by 2 or more Vehicles in Household
In terms of 2 or more vehicles in household, the demographic groups most similar to Immigrants from Egypt are Brazilian (53.8%, a difference of 0.010%), Immigrants from Eastern Africa (53.7%, a difference of 0.020%), Immigrants from Bosnia and Herzegovina (53.8%, a difference of 0.050%), Kiowa (53.9%, a difference of 0.18%), and Immigrants from Singapore (53.9%, a difference of 0.20%).
| Demographics | Rating | Rank | 2 or more Vehicles in Household |
| Immigrants | Argentina | 6.8 /100 | #218 | Tragic 53.9% |
| South American Indians | 6.5 /100 | #219 | Tragic 53.9% |
| Taiwanese | 6.3 /100 | #220 | Tragic 53.9% |
| Immigrants | Singapore | 6.3 /100 | #221 | Tragic 53.9% |
| Kiowa | 6.2 /100 | #222 | Tragic 53.9% |
| Immigrants | Bosnia and Herzegovina | 5.5 /100 | #223 | Tragic 53.8% |
| Brazilians | 5.3 /100 | #224 | Tragic 53.8% |
| Immigrants | Egypt | 5.2 /100 | #225 | Tragic 53.8% |
| Immigrants | Eastern Africa | 5.1 /100 | #226 | Tragic 53.7% |
| Sudanese | 4.1 /100 | #227 | Tragic 53.6% |
| Alaska Natives | 3.9 /100 | #228 | Tragic 53.6% |
| Immigrants | Turkey | 3.8 /100 | #229 | Tragic 53.6% |
| Immigrants | Nepal | 3.6 /100 | #230 | Tragic 53.5% |
| Panamanians | 3.4 /100 | #231 | Tragic 53.5% |
| Immigrants | Guatemala | 3.2 /100 | #232 | Tragic 53.5% |