Cambodian vs Immigrants from Egypt In Labor Force | Age 16-19
COMPARE
Cambodian
Immigrants from Egypt
In Labor Force | Age 16-19
In Labor Force | Age 16-19 Comparison
Cambodians
Immigrants from Egypt
37.0%
IN LABOR FORCE | AGE 16-19
71.5/ 100
METRIC RATING
161st/ 347
METRIC RANK
34.6%
IN LABOR FORCE | AGE 16-19
1.2/ 100
METRIC RATING
257th/ 347
METRIC RANK
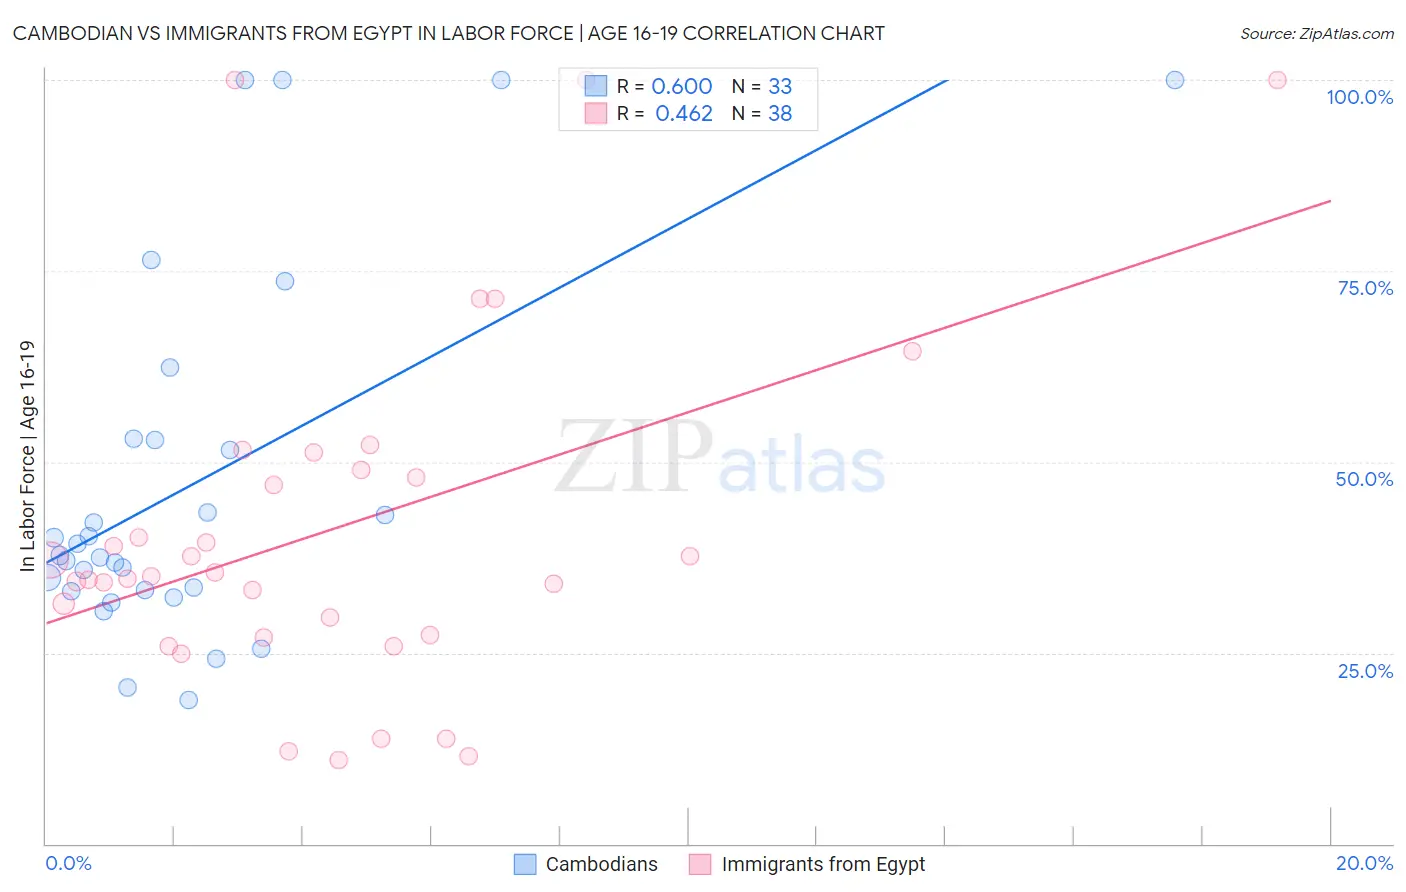
Cambodian vs Immigrants from Egypt In Labor Force | Age 16-19 Correlation Chart
The statistical analysis conducted on geographies consisting of 102,494,767 people shows a significant positive correlation between the proportion of Cambodians and labor force participation rate among population between the ages 16 and 19 in the United States with a correlation coefficient (R) of 0.600 and weighted average of 37.0%. Similarly, the statistical analysis conducted on geographies consisting of 245,278,440 people shows a moderate positive correlation between the proportion of Immigrants from Egypt and labor force participation rate among population between the ages 16 and 19 in the United States with a correlation coefficient (R) of 0.462 and weighted average of 34.6%, a difference of 7.0%.
In Labor Force | Age 16-19 Correlation Summary
| Measurement | Cambodian | Immigrants from Egypt |
| Minimum | 18.8% | 11.0% |
| Maximum | 100.0% | 100.0% |
| Range | 81.2% | 89.0% |
| Mean | 47.2% | 41.2% |
| Median | 37.7% | 35.3% |
| Interquartile 25% (IQ1) | 33.2% | 27.4% |
| Interquartile 75% (IQ3) | 53.0% | 48.9% |
| Interquartile Range (IQR) | 19.8% | 21.5% |
| Standard Deviation (Sample) | 23.6% | 22.7% |
| Standard Deviation (Population) | 23.3% | 22.4% |
Similar Demographics by In Labor Force | Age 16-19
Demographics Similar to Cambodians by In Labor Force | Age 16-19
In terms of in labor force | age 16-19, the demographic groups most similar to Cambodians are Immigrants from Jordan (36.9%, a difference of 0.12%), Bermudan (36.9%, a difference of 0.13%), Immigrants from Saudi Arabia (37.0%, a difference of 0.15%), Immigrants from Kuwait (36.9%, a difference of 0.16%), and Yaqui (37.1%, a difference of 0.18%).
| Demographics | Rating | Rank | In Labor Force | Age 16-19 |
| Immigrants | Bulgaria | 81.6 /100 | #154 | Excellent 37.3% |
| Immigrants | Lithuania | 80.7 /100 | #155 | Excellent 37.2% |
| Kiowa | 80.4 /100 | #156 | Excellent 37.2% |
| Immigrants | Brazil | 76.5 /100 | #157 | Good 37.1% |
| Ute | 75.7 /100 | #158 | Good 37.1% |
| Yaqui | 74.4 /100 | #159 | Good 37.1% |
| Immigrants | Saudi Arabia | 73.9 /100 | #160 | Good 37.0% |
| Cambodians | 71.5 /100 | #161 | Good 37.0% |
| Immigrants | Jordan | 69.5 /100 | #162 | Good 36.9% |
| Bermudans | 69.3 /100 | #163 | Good 36.9% |
| Immigrants | Kuwait | 68.9 /100 | #164 | Good 36.9% |
| Yakama | 66.9 /100 | #165 | Good 36.9% |
| Immigrants | Western Africa | 66.7 /100 | #166 | Good 36.9% |
| Arabs | 63.6 /100 | #167 | Good 36.8% |
| Palestinians | 63.1 /100 | #168 | Good 36.8% |
Demographics Similar to Immigrants from Egypt by In Labor Force | Age 16-19
In terms of in labor force | age 16-19, the demographic groups most similar to Immigrants from Egypt are Immigrants from South Central Asia (34.6%, a difference of 0.010%), Thai (34.6%, a difference of 0.010%), Immigrants (34.6%, a difference of 0.020%), Egyptian (34.5%, a difference of 0.10%), and Peruvian (34.6%, a difference of 0.11%).
| Demographics | Rating | Rank | In Labor Force | Age 16-19 |
| Immigrants | Pakistan | 2.0 /100 | #250 | Tragic 34.8% |
| Immigrants | Western Asia | 2.0 /100 | #251 | Tragic 34.8% |
| Immigrants | Chile | 2.0 /100 | #252 | Tragic 34.8% |
| Immigrants | Japan | 1.5 /100 | #253 | Tragic 34.7% |
| Bahamians | 1.4 /100 | #254 | Tragic 34.6% |
| Peruvians | 1.4 /100 | #255 | Tragic 34.6% |
| Immigrants | South Central Asia | 1.3 /100 | #256 | Tragic 34.6% |
| Immigrants | Egypt | 1.2 /100 | #257 | Tragic 34.6% |
| Thais | 1.2 /100 | #258 | Tragic 34.6% |
| Immigrants | Immigrants | 1.2 /100 | #259 | Tragic 34.6% |
| Egyptians | 1.2 /100 | #260 | Tragic 34.5% |
| Salvadorans | 1.1 /100 | #261 | Tragic 34.5% |
| Hispanics or Latinos | 1.1 /100 | #262 | Tragic 34.5% |
| Burmese | 1.1 /100 | #263 | Tragic 34.5% |
| Immigrants | Uruguay | 0.9 /100 | #264 | Tragic 34.4% |