Spanish vs Aleut 3 or more Vehicles in Household
COMPARE
Spanish
Aleut
3 or more Vehicles in Household
3 or more Vehicles in Household Comparison
Spanish
Aleuts
23.1%
3 OR MORE VEHICLES IN HOUSEHOLD
100.0/ 100
METRIC RATING
29th/ 347
METRIC RANK
20.2%
3 OR MORE VEHICLES IN HOUSEHOLD
86.3/ 100
METRIC RATING
138th/ 347
METRIC RANK
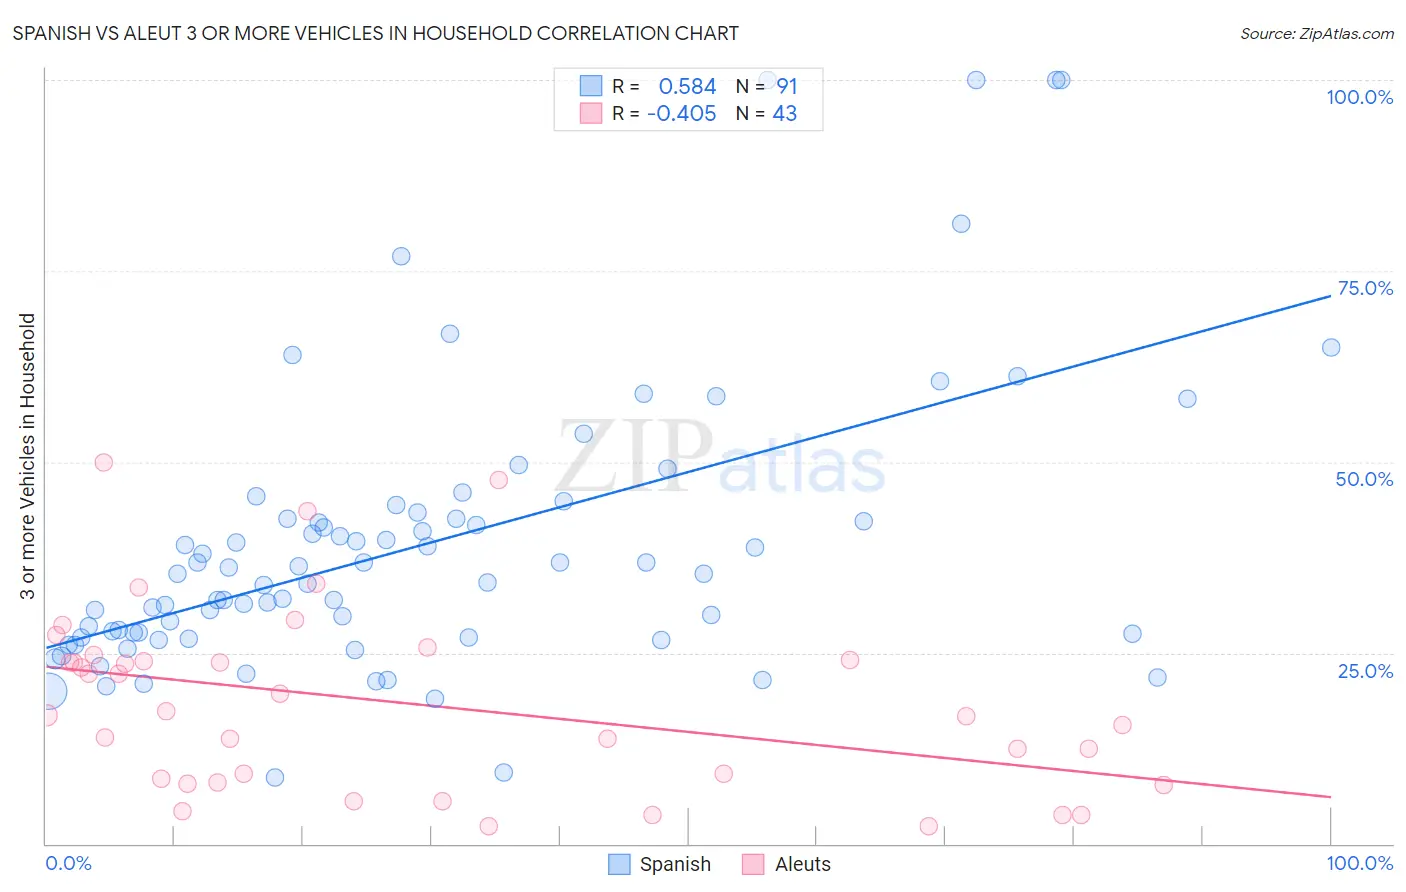
Spanish vs Aleut 3 or more Vehicles in Household Correlation Chart
The statistical analysis conducted on geographies consisting of 421,817,917 people shows a substantial positive correlation between the proportion of Spanish and percentage of households with 3 or more vehicles available in the United States with a correlation coefficient (R) of 0.584 and weighted average of 23.1%. Similarly, the statistical analysis conducted on geographies consisting of 61,759,938 people shows a moderate negative correlation between the proportion of Aleuts and percentage of households with 3 or more vehicles available in the United States with a correlation coefficient (R) of -0.405 and weighted average of 20.2%, a difference of 14.6%.
3 or more Vehicles in Household Correlation Summary
| Measurement | Spanish | Aleut |
| Minimum | 8.7% | 2.3% |
| Maximum | 100.0% | 50.0% |
| Range | 91.3% | 47.7% |
| Mean | 39.1% | 18.3% |
| Median | 35.3% | 16.8% |
| Interquartile 25% (IQ1) | 27.1% | 8.0% |
| Interquartile 75% (IQ3) | 42.6% | 24.0% |
| Interquartile Range (IQR) | 15.5% | 16.0% |
| Standard Deviation (Sample) | 18.7% | 12.0% |
| Standard Deviation (Population) | 18.6% | 11.8% |
Similar Demographics by 3 or more Vehicles in Household
Demographics Similar to Spanish by 3 or more Vehicles in Household
In terms of 3 or more vehicles in household, the demographic groups most similar to Spanish are Lumbee (23.1%, a difference of 0.070%), Immigrants from South Eastern Asia (23.1%, a difference of 0.17%), English (23.1%, a difference of 0.36%), Guamanian/Chamorro (23.2%, a difference of 0.40%), and Pueblo (23.0%, a difference of 0.45%).
| Demographics | Rating | Rank | 3 or more Vehicles in Household |
| Immigrants | Philippines | 100.0 /100 | #22 | Exceptional 23.8% |
| Scandinavians | 100.0 /100 | #23 | Exceptional 23.6% |
| Sri Lankans | 100.0 /100 | #24 | Exceptional 23.6% |
| Immigrants | Central America | 100.0 /100 | #25 | Exceptional 23.4% |
| Mexican American Indians | 100.0 /100 | #26 | Exceptional 23.3% |
| Guamanians/Chamorros | 100.0 /100 | #27 | Exceptional 23.2% |
| Lumbee | 100.0 /100 | #28 | Exceptional 23.1% |
| Spanish | 100.0 /100 | #29 | Exceptional 23.1% |
| Immigrants | South Eastern Asia | 100.0 /100 | #30 | Exceptional 23.1% |
| English | 100.0 /100 | #31 | Exceptional 23.1% |
| Pueblo | 100.0 /100 | #32 | Exceptional 23.0% |
| Spanish Americans | 100.0 /100 | #33 | Exceptional 23.0% |
| Swiss | 100.0 /100 | #34 | Exceptional 23.0% |
| Choctaw | 100.0 /100 | #35 | Exceptional 23.0% |
| Cherokee | 100.0 /100 | #36 | Exceptional 23.0% |
Demographics Similar to Aleuts by 3 or more Vehicles in Household
In terms of 3 or more vehicles in household, the demographic groups most similar to Aleuts are Immigrants from Nicaragua (20.2%, a difference of 0.12%), Immigrants from Iraq (20.2%, a difference of 0.12%), Slovene (20.2%, a difference of 0.12%), Immigrants from India (20.2%, a difference of 0.13%), and French American Indian (20.1%, a difference of 0.15%).
| Demographics | Rating | Rank | 3 or more Vehicles in Household |
| Immigrants | Asia | 88.1 /100 | #131 | Excellent 20.2% |
| Immigrants | Canada | 87.8 /100 | #132 | Excellent 20.2% |
| Immigrants | North America | 87.8 /100 | #133 | Excellent 20.2% |
| Poles | 87.3 /100 | #134 | Excellent 20.2% |
| Immigrants | India | 87.2 /100 | #135 | Excellent 20.2% |
| Immigrants | Nicaragua | 87.1 /100 | #136 | Excellent 20.2% |
| Immigrants | Iraq | 87.1 /100 | #137 | Excellent 20.2% |
| Aleuts | 86.3 /100 | #138 | Excellent 20.2% |
| Slovenes | 85.5 /100 | #139 | Excellent 20.2% |
| French American Indians | 85.3 /100 | #140 | Excellent 20.1% |
| Ottawa | 84.9 /100 | #141 | Excellent 20.1% |
| Jordanians | 84.4 /100 | #142 | Excellent 20.1% |
| Lithuanians | 84.4 /100 | #143 | Excellent 20.1% |
| Iranians | 84.0 /100 | #144 | Excellent 20.1% |
| Palestinians | 83.9 /100 | #145 | Excellent 20.1% |