White/Caucasian vs Yup'ik No Vehicles in Household
COMPARE
White/Caucasian
Yup'ik
No Vehicles in Household
No Vehicles in Household Comparison
Whites/Caucasians
Yup'ik
7.0%
NO VEHICLES IN HOUSEHOLD
100.0/ 100
METRIC RATING
15th/ 347
METRIC RANK
45.9%
NO VEHICLES IN HOUSEHOLD
0.0/ 100
METRIC RATING
347th/ 347
METRIC RANK
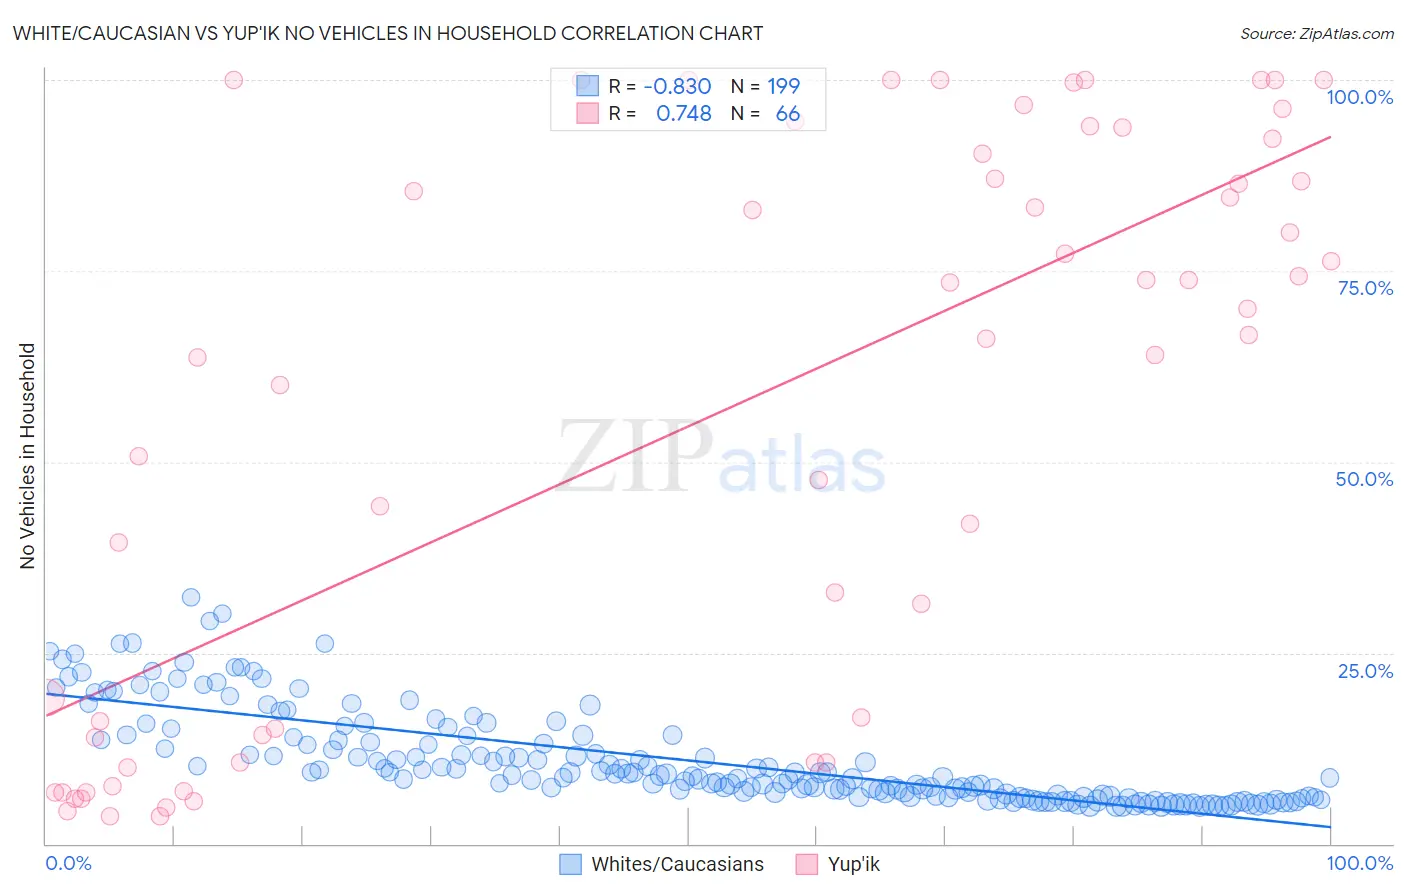
White/Caucasian vs Yup'ik No Vehicles in Household Correlation Chart
The statistical analysis conducted on geographies consisting of 564,577,305 people shows a very strong negative correlation between the proportion of Whites/Caucasians and percentage of households with no vehicle available in the United States with a correlation coefficient (R) of -0.830 and weighted average of 7.0%. Similarly, the statistical analysis conducted on geographies consisting of 39,930,704 people shows a strong positive correlation between the proportion of Yup'ik and percentage of households with no vehicle available in the United States with a correlation coefficient (R) of 0.748 and weighted average of 45.9%, a difference of 552.3%.
No Vehicles in Household Correlation Summary
| Measurement | White/Caucasian | Yup'ik |
| Minimum | 4.8% | 3.5% |
| Maximum | 32.3% | 100.0% |
| Range | 27.4% | 96.5% |
| Mean | 10.9% | 55.6% |
| Median | 8.7% | 66.4% |
| Interquartile 25% (IQ1) | 6.2% | 14.0% |
| Interquartile 75% (IQ3) | 13.6% | 90.4% |
| Interquartile Range (IQR) | 7.4% | 76.4% |
| Standard Deviation (Sample) | 6.1% | 37.0% |
| Standard Deviation (Population) | 6.1% | 36.7% |
Similar Demographics by No Vehicles in Household
Demographics Similar to Whites/Caucasians by No Vehicles in Household
In terms of no vehicles in household, the demographic groups most similar to Whites/Caucasians are Mexican (7.0%, a difference of 0.13%), Scandinavian (7.0%, a difference of 0.30%), Assyrian/Chaldean/Syriac (7.0%, a difference of 0.80%), European (7.1%, a difference of 1.1%), and Welsh (7.2%, a difference of 1.7%).
| Demographics | Rating | Rank | No Vehicles in Household |
| Swedes | 100.0 /100 | #8 | Exceptional 6.8% |
| Scotch-Irish | 100.0 /100 | #9 | Exceptional 6.8% |
| Dutch | 100.0 /100 | #10 | Exceptional 6.8% |
| Czechs | 100.0 /100 | #11 | Exceptional 6.9% |
| Assyrians/Chaldeans/Syriacs | 100.0 /100 | #12 | Exceptional 7.0% |
| Scandinavians | 100.0 /100 | #13 | Exceptional 7.0% |
| Mexicans | 100.0 /100 | #14 | Exceptional 7.0% |
| Whites/Caucasians | 100.0 /100 | #15 | Exceptional 7.0% |
| Europeans | 100.0 /100 | #16 | Exceptional 7.1% |
| Welsh | 100.0 /100 | #17 | Exceptional 7.2% |
| Tongans | 100.0 /100 | #18 | Exceptional 7.2% |
| Arapaho | 100.0 /100 | #19 | Exceptional 7.4% |
| Ottawa | 100.0 /100 | #20 | Exceptional 7.4% |
| Nepalese | 100.0 /100 | #21 | Exceptional 7.4% |
| Irish | 100.0 /100 | #22 | Exceptional 7.4% |
Demographics Similar to Yup'ik by No Vehicles in Household
In terms of no vehicles in household, the demographic groups most similar to Yup'ik are Immigrants from Grenada (37.5%, a difference of 22.5%), Immigrants from St. Vincent and the Grenadines (35.4%, a difference of 29.6%), Immigrants from Dominican Republic (31.4%, a difference of 46.0%), Inupiat (29.9%, a difference of 53.6%), and British West Indian (29.7%, a difference of 54.3%).
| Demographics | Rating | Rank | No Vehicles in Household |
| Immigrants | Trinidad and Tobago | 0.0 /100 | #333 | Tragic 24.6% |
| Immigrants | Bangladesh | 0.0 /100 | #334 | Tragic 25.8% |
| Barbadians | 0.0 /100 | #335 | Tragic 26.1% |
| Vietnamese | 0.0 /100 | #336 | Tragic 26.2% |
| Immigrants | Uzbekistan | 0.0 /100 | #337 | Tragic 26.7% |
| Guyanese | 0.0 /100 | #338 | Tragic 29.3% |
| Dominicans | 0.0 /100 | #339 | Tragic 29.4% |
| Immigrants | Barbados | 0.0 /100 | #340 | Tragic 29.5% |
| Immigrants | Guyana | 0.0 /100 | #341 | Tragic 29.5% |
| British West Indians | 0.0 /100 | #342 | Tragic 29.7% |
| Inupiat | 0.0 /100 | #343 | Tragic 29.9% |
| Immigrants | Dominican Republic | 0.0 /100 | #344 | Tragic 31.4% |
| Immigrants | St. Vincent and the Grenadines | 0.0 /100 | #345 | Tragic 35.4% |
| Immigrants | Grenada | 0.0 /100 | #346 | Tragic 37.5% |
| Yup'ik | 0.0 /100 | #347 | Tragic 45.9% |