Austrian vs South American Indian No Vehicles in Household
COMPARE
Austrian
South American Indian
No Vehicles in Household
No Vehicles in Household Comparison
Austrians
South American Indians
8.8%
NO VEHICLES IN HOUSEHOLD
98.9/ 100
METRIC RATING
94th/ 347
METRIC RANK
12.1%
NO VEHICLES IN HOUSEHOLD
0.9/ 100
METRIC RATING
258th/ 347
METRIC RANK
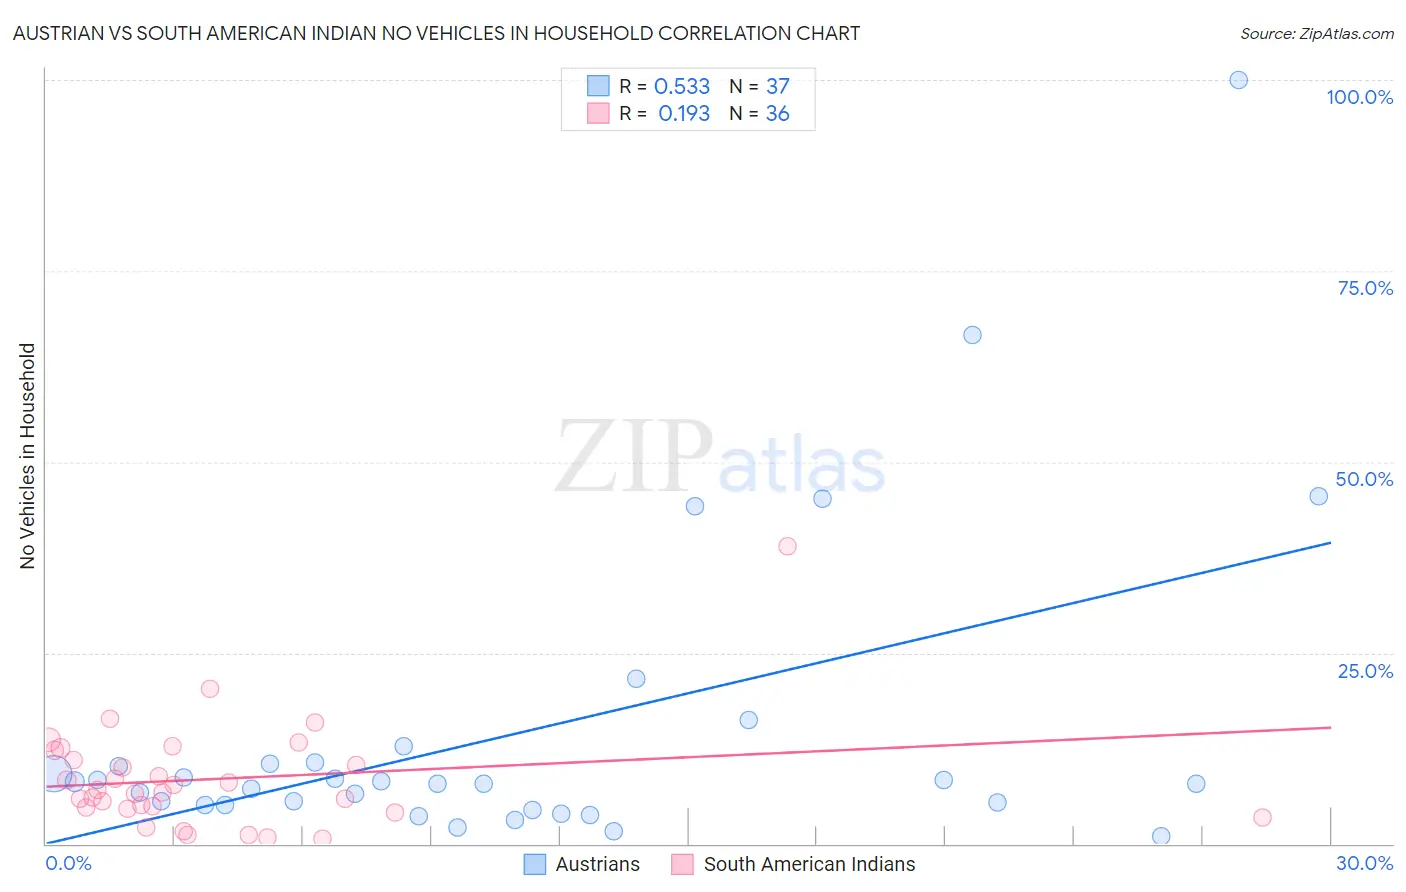
Austrian vs South American Indian No Vehicles in Household Correlation Chart
The statistical analysis conducted on geographies consisting of 450,345,618 people shows a substantial positive correlation between the proportion of Austrians and percentage of households with no vehicle available in the United States with a correlation coefficient (R) of 0.533 and weighted average of 8.8%. Similarly, the statistical analysis conducted on geographies consisting of 164,483,116 people shows a poor positive correlation between the proportion of South American Indians and percentage of households with no vehicle available in the United States with a correlation coefficient (R) of 0.193 and weighted average of 12.1%, a difference of 36.6%.
No Vehicles in Household Correlation Summary
| Measurement | Austrian | South American Indian |
| Minimum | 0.94% | 0.72% |
| Maximum | 100.0% | 38.9% |
| Range | 99.1% | 38.2% |
| Mean | 14.5% | 8.5% |
| Median | 7.9% | 6.9% |
| Interquartile 25% (IQ1) | 5.1% | 4.7% |
| Interquartile 75% (IQ3) | 10.5% | 11.5% |
| Interquartile Range (IQR) | 5.4% | 6.9% |
| Standard Deviation (Sample) | 20.4% | 7.0% |
| Standard Deviation (Population) | 20.1% | 6.9% |
Similar Demographics by No Vehicles in Household
Demographics Similar to Austrians by No Vehicles in Household
In terms of no vehicles in household, the demographic groups most similar to Austrians are Potawatomi (8.8%, a difference of 0.14%), Immigrants from Bolivia (8.9%, a difference of 0.43%), Immigrants from North America (8.7%, a difference of 0.95%), Immigrants from Central America (8.9%, a difference of 1.1%), and Immigrants from Canada (8.7%, a difference of 1.1%).
| Demographics | Rating | Rank | No Vehicles in Household |
| Immigrants | England | 99.2 /100 | #87 | Exceptional 8.7% |
| Osage | 99.2 /100 | #88 | Exceptional 8.7% |
| Immigrants | Cuba | 99.2 /100 | #89 | Exceptional 8.7% |
| Bhutanese | 99.2 /100 | #90 | Exceptional 8.7% |
| Immigrants | Germany | 99.1 /100 | #91 | Exceptional 8.7% |
| Immigrants | Canada | 99.1 /100 | #92 | Exceptional 8.7% |
| Immigrants | North America | 99.1 /100 | #93 | Exceptional 8.7% |
| Austrians | 98.9 /100 | #94 | Exceptional 8.8% |
| Potawatomi | 98.8 /100 | #95 | Exceptional 8.8% |
| Immigrants | Bolivia | 98.7 /100 | #96 | Exceptional 8.9% |
| Immigrants | Central America | 98.5 /100 | #97 | Exceptional 8.9% |
| Slavs | 98.4 /100 | #98 | Exceptional 9.0% |
| Bulgarians | 98.4 /100 | #99 | Exceptional 9.0% |
| Asians | 98.3 /100 | #100 | Exceptional 9.0% |
| Pakistanis | 98.3 /100 | #101 | Exceptional 9.0% |
Demographics Similar to South American Indians by No Vehicles in Household
In terms of no vehicles in household, the demographic groups most similar to South American Indians are Nigerian (12.1%, a difference of 0.020%), Immigrants from Latvia (12.1%, a difference of 0.24%), Liberian (12.0%, a difference of 0.76%), Macedonian (12.2%, a difference of 0.80%), and Honduran (12.0%, a difference of 0.81%).
| Demographics | Rating | Rank | No Vehicles in Household |
| Blacks/African Americans | 1.6 /100 | #251 | Tragic 11.9% |
| Immigrants | Serbia | 1.5 /100 | #252 | Tragic 11.9% |
| Egyptians | 1.4 /100 | #253 | Tragic 11.9% |
| Immigrants | Uruguay | 1.3 /100 | #254 | Tragic 11.9% |
| Hondurans | 1.2 /100 | #255 | Tragic 12.0% |
| Liberians | 1.2 /100 | #256 | Tragic 12.0% |
| Nigerians | 0.9 /100 | #257 | Tragic 12.1% |
| South American Indians | 0.9 /100 | #258 | Tragic 12.1% |
| Immigrants | Latvia | 0.8 /100 | #259 | Tragic 12.1% |
| Macedonians | 0.7 /100 | #260 | Tragic 12.2% |
| Sub-Saharan Africans | 0.6 /100 | #261 | Tragic 12.2% |
| Immigrants | Liberia | 0.6 /100 | #262 | Tragic 12.2% |
| Immigrants | Egypt | 0.6 /100 | #263 | Tragic 12.2% |
| Immigrants | Switzerland | 0.5 /100 | #264 | Tragic 12.3% |
| Africans | 0.4 /100 | #265 | Tragic 12.3% |