Immigrants from Cuba vs South American Indian No Vehicles in Household
COMPARE
Immigrants from Cuba
South American Indian
No Vehicles in Household
No Vehicles in Household Comparison
Immigrants from Cuba
South American Indians
8.7%
NO VEHICLES IN HOUSEHOLD
99.2/ 100
METRIC RATING
89th/ 347
METRIC RANK
12.1%
NO VEHICLES IN HOUSEHOLD
0.9/ 100
METRIC RATING
258th/ 347
METRIC RANK
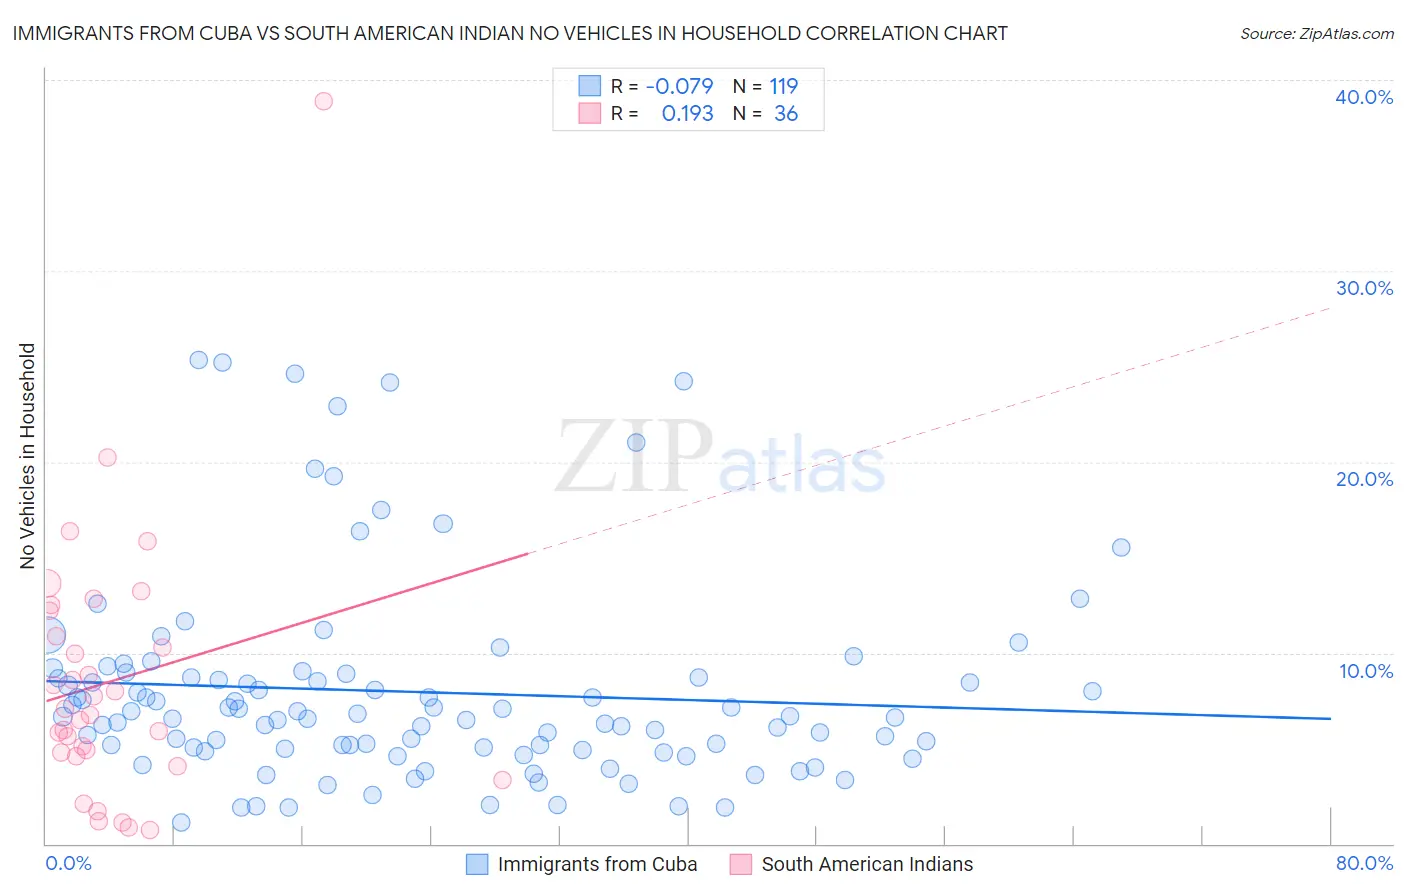
Immigrants from Cuba vs South American Indian No Vehicles in Household Correlation Chart
The statistical analysis conducted on geographies consisting of 325,235,999 people shows a slight negative correlation between the proportion of Immigrants from Cuba and percentage of households with no vehicle available in the United States with a correlation coefficient (R) of -0.079 and weighted average of 8.7%. Similarly, the statistical analysis conducted on geographies consisting of 164,483,116 people shows a poor positive correlation between the proportion of South American Indians and percentage of households with no vehicle available in the United States with a correlation coefficient (R) of 0.193 and weighted average of 12.1%, a difference of 38.6%.
No Vehicles in Household Correlation Summary
| Measurement | Immigrants from Cuba | South American Indian |
| Minimum | 1.1% | 0.72% |
| Maximum | 25.3% | 38.9% |
| Range | 24.2% | 38.2% |
| Mean | 8.0% | 8.5% |
| Median | 6.6% | 6.9% |
| Interquartile 25% (IQ1) | 5.0% | 4.7% |
| Interquartile 75% (IQ3) | 8.7% | 11.5% |
| Interquartile Range (IQR) | 3.7% | 6.9% |
| Standard Deviation (Sample) | 5.3% | 7.0% |
| Standard Deviation (Population) | 5.3% | 6.9% |
Similar Demographics by No Vehicles in Household
Demographics Similar to Immigrants from Cuba by No Vehicles in Household
In terms of no vehicles in household, the demographic groups most similar to Immigrants from Cuba are Bhutanese (8.7%, a difference of 0.090%), Osage (8.7%, a difference of 0.14%), Immigrants from England (8.7%, a difference of 0.26%), Immigrants from Germany (8.7%, a difference of 0.28%), and Immigrants from Canada (8.7%, a difference of 0.30%).
| Demographics | Rating | Rank | No Vehicles in Household |
| Immigrants | South Eastern Asia | 99.4 /100 | #82 | Exceptional 8.6% |
| Italians | 99.4 /100 | #83 | Exceptional 8.6% |
| Immigrants | Jordan | 99.3 /100 | #84 | Exceptional 8.7% |
| Lebanese | 99.3 /100 | #85 | Exceptional 8.7% |
| Bangladeshis | 99.3 /100 | #86 | Exceptional 8.7% |
| Immigrants | England | 99.2 /100 | #87 | Exceptional 8.7% |
| Osage | 99.2 /100 | #88 | Exceptional 8.7% |
| Immigrants | Cuba | 99.2 /100 | #89 | Exceptional 8.7% |
| Bhutanese | 99.2 /100 | #90 | Exceptional 8.7% |
| Immigrants | Germany | 99.1 /100 | #91 | Exceptional 8.7% |
| Immigrants | Canada | 99.1 /100 | #92 | Exceptional 8.7% |
| Immigrants | North America | 99.1 /100 | #93 | Exceptional 8.7% |
| Austrians | 98.9 /100 | #94 | Exceptional 8.8% |
| Potawatomi | 98.8 /100 | #95 | Exceptional 8.8% |
| Immigrants | Bolivia | 98.7 /100 | #96 | Exceptional 8.9% |
Demographics Similar to South American Indians by No Vehicles in Household
In terms of no vehicles in household, the demographic groups most similar to South American Indians are Nigerian (12.1%, a difference of 0.020%), Immigrants from Latvia (12.1%, a difference of 0.24%), Liberian (12.0%, a difference of 0.76%), Macedonian (12.2%, a difference of 0.80%), and Honduran (12.0%, a difference of 0.81%).
| Demographics | Rating | Rank | No Vehicles in Household |
| Blacks/African Americans | 1.6 /100 | #251 | Tragic 11.9% |
| Immigrants | Serbia | 1.5 /100 | #252 | Tragic 11.9% |
| Egyptians | 1.4 /100 | #253 | Tragic 11.9% |
| Immigrants | Uruguay | 1.3 /100 | #254 | Tragic 11.9% |
| Hondurans | 1.2 /100 | #255 | Tragic 12.0% |
| Liberians | 1.2 /100 | #256 | Tragic 12.0% |
| Nigerians | 0.9 /100 | #257 | Tragic 12.1% |
| South American Indians | 0.9 /100 | #258 | Tragic 12.1% |
| Immigrants | Latvia | 0.8 /100 | #259 | Tragic 12.1% |
| Macedonians | 0.7 /100 | #260 | Tragic 12.2% |
| Sub-Saharan Africans | 0.6 /100 | #261 | Tragic 12.2% |
| Immigrants | Liberia | 0.6 /100 | #262 | Tragic 12.2% |
| Immigrants | Egypt | 0.6 /100 | #263 | Tragic 12.2% |
| Immigrants | Switzerland | 0.5 /100 | #264 | Tragic 12.3% |
| Africans | 0.4 /100 | #265 | Tragic 12.3% |