Black/African American vs Alsatian 3 or more Vehicles in Household
COMPARE
Black/African American
Alsatian
3 or more Vehicles in Household
3 or more Vehicles in Household Comparison
Blacks/African Americans
Alsatians
17.3%
3 OR MORE VEHICLES IN HOUSEHOLD
0.3/ 100
METRIC RATING
283rd/ 347
METRIC RANK
18.0%
3 OR MORE VEHICLES IN HOUSEHOLD
1.5/ 100
METRIC RATING
251st/ 347
METRIC RANK
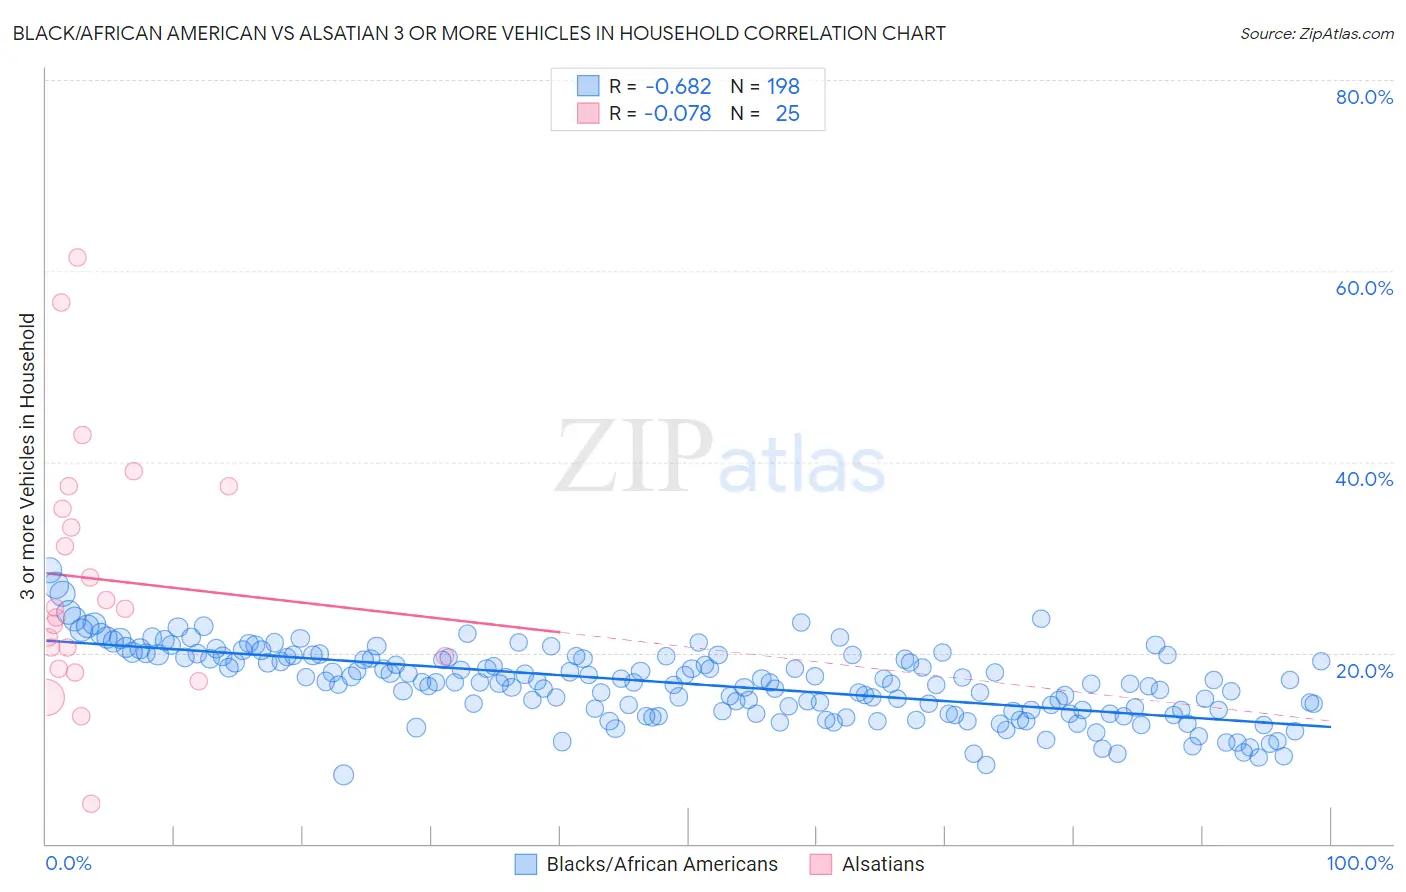
Black/African American vs Alsatian 3 or more Vehicles in Household Correlation Chart
The statistical analysis conducted on geographies consisting of 564,977,074 people shows a significant negative correlation between the proportion of Blacks/African Americans and percentage of households with 3 or more vehicles available in the United States with a correlation coefficient (R) of -0.682 and weighted average of 17.3%. Similarly, the statistical analysis conducted on geographies consisting of 82,678,763 people shows a slight negative correlation between the proportion of Alsatians and percentage of households with 3 or more vehicles available in the United States with a correlation coefficient (R) of -0.078 and weighted average of 18.0%, a difference of 3.7%.
3 or more Vehicles in Household Correlation Summary
| Measurement | Black/African American | Alsatian |
| Minimum | 7.2% | 4.2% |
| Maximum | 28.7% | 61.3% |
| Range | 21.4% | 57.1% |
| Mean | 16.8% | 27.7% |
| Median | 16.9% | 24.6% |
| Interquartile 25% (IQ1) | 14.0% | 19.0% |
| Interquartile 75% (IQ3) | 19.6% | 36.3% |
| Interquartile Range (IQR) | 5.6% | 17.3% |
| Standard Deviation (Sample) | 3.8% | 13.1% |
| Standard Deviation (Population) | 3.8% | 12.8% |
Similar Demographics by 3 or more Vehicles in Household
Demographics Similar to Blacks/African Americans by 3 or more Vehicles in Household
In terms of 3 or more vehicles in household, the demographic groups most similar to Blacks/African Americans are Immigrants from Ireland (17.3%, a difference of 0.050%), Immigrants from Colombia (17.3%, a difference of 0.12%), Immigrants from Latvia (17.4%, a difference of 0.34%), Immigrants from Eastern Europe (17.4%, a difference of 0.38%), and Immigrants from Kazakhstan (17.4%, a difference of 0.42%).
| Demographics | Rating | Rank | 3 or more Vehicles in Household |
| Okinawans | 0.4 /100 | #276 | Tragic 17.4% |
| Brazilians | 0.4 /100 | #277 | Tragic 17.4% |
| Immigrants | Bahamas | 0.3 /100 | #278 | Tragic 17.4% |
| Immigrants | Kazakhstan | 0.3 /100 | #279 | Tragic 17.4% |
| Immigrants | Eastern Europe | 0.3 /100 | #280 | Tragic 17.4% |
| Immigrants | Latvia | 0.3 /100 | #281 | Tragic 17.4% |
| Immigrants | Ireland | 0.3 /100 | #282 | Tragic 17.3% |
| Blacks/African Americans | 0.3 /100 | #283 | Tragic 17.3% |
| Immigrants | Colombia | 0.3 /100 | #284 | Tragic 17.3% |
| Immigrants | Croatia | 0.2 /100 | #285 | Tragic 17.2% |
| Menominee | 0.2 /100 | #286 | Tragic 17.2% |
| Immigrants | Brazil | 0.2 /100 | #287 | Tragic 17.1% |
| Immigrants | Uruguay | 0.2 /100 | #288 | Tragic 17.1% |
| Immigrants | Liberia | 0.1 /100 | #289 | Tragic 17.1% |
| Liberians | 0.1 /100 | #290 | Tragic 17.0% |
Demographics Similar to Alsatians by 3 or more Vehicles in Household
In terms of 3 or more vehicles in household, the demographic groups most similar to Alsatians are Venezuelan (18.0%, a difference of 0.20%), Immigrants from Saudi Arabia (18.0%, a difference of 0.22%), Immigrants from Southern Europe (17.9%, a difference of 0.23%), Immigrants from Eastern Africa (18.0%, a difference of 0.28%), and Carpatho Rusyn (18.0%, a difference of 0.41%).
| Demographics | Rating | Rank | 3 or more Vehicles in Household |
| Mongolians | 2.3 /100 | #244 | Tragic 18.1% |
| Immigrants | Belize | 2.1 /100 | #245 | Tragic 18.1% |
| Immigrants | Australia | 2.0 /100 | #246 | Tragic 18.1% |
| Carpatho Rusyns | 1.9 /100 | #247 | Tragic 18.0% |
| Immigrants | Eastern Africa | 1.8 /100 | #248 | Tragic 18.0% |
| Immigrants | Saudi Arabia | 1.7 /100 | #249 | Tragic 18.0% |
| Venezuelans | 1.7 /100 | #250 | Tragic 18.0% |
| Alsatians | 1.5 /100 | #251 | Tragic 18.0% |
| Immigrants | Southern Europe | 1.4 /100 | #252 | Tragic 17.9% |
| Immigrants | Ethiopia | 1.3 /100 | #253 | Tragic 17.9% |
| Ethiopians | 1.2 /100 | #254 | Tragic 17.9% |
| Immigrants | Turkey | 1.2 /100 | #255 | Tragic 17.9% |
| Sub-Saharan Africans | 1.1 /100 | #256 | Tragic 17.9% |
| Immigrants | Eritrea | 1.1 /100 | #257 | Tragic 17.8% |
| Sudanese | 1.1 /100 | #258 | Tragic 17.8% |