Immigrants from North Macedonia vs Immigrants from Morocco No Vehicles in Household
COMPARE
Immigrants from North Macedonia
Immigrants from Morocco
No Vehicles in Household
No Vehicles in Household Comparison
Immigrants from North Macedonia
Immigrants from Morocco
10.6%
NO VEHICLES IN HOUSEHOLD
34.6/ 100
METRIC RATING
190th/ 347
METRIC RANK
12.6%
NO VEHICLES IN HOUSEHOLD
0.2/ 100
METRIC RATING
271st/ 347
METRIC RANK
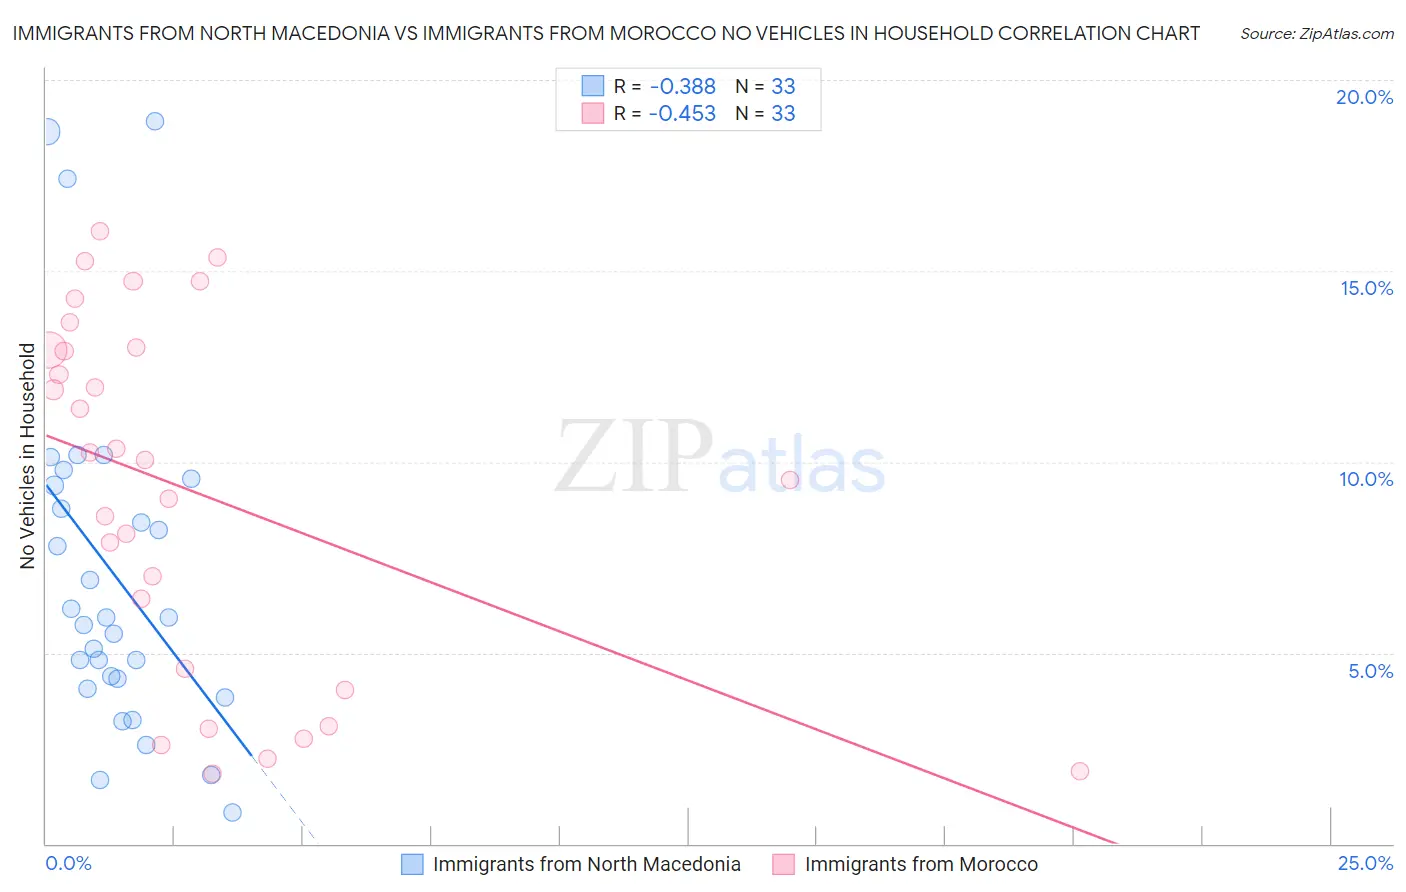
Immigrants from North Macedonia vs Immigrants from Morocco No Vehicles in Household Correlation Chart
The statistical analysis conducted on geographies consisting of 73,975,262 people shows a mild negative correlation between the proportion of Immigrants from North Macedonia and percentage of households with no vehicle available in the United States with a correlation coefficient (R) of -0.388 and weighted average of 10.6%. Similarly, the statistical analysis conducted on geographies consisting of 178,744,032 people shows a moderate negative correlation between the proportion of Immigrants from Morocco and percentage of households with no vehicle available in the United States with a correlation coefficient (R) of -0.453 and weighted average of 12.6%, a difference of 18.7%.
No Vehicles in Household Correlation Summary
| Measurement | Immigrants from North Macedonia | Immigrants from Morocco |
| Minimum | 0.82% | 1.8% |
| Maximum | 18.9% | 16.0% |
| Range | 18.1% | 14.2% |
| Mean | 7.1% | 9.2% |
| Median | 5.9% | 10.0% |
| Interquartile 25% (IQ1) | 4.2% | 4.3% |
| Interquartile 75% (IQ3) | 9.5% | 13.0% |
| Interquartile Range (IQR) | 5.3% | 8.7% |
| Standard Deviation (Sample) | 4.5% | 4.6% |
| Standard Deviation (Population) | 4.4% | 4.6% |
Similar Demographics by No Vehicles in Household
Demographics Similar to Immigrants from North Macedonia by No Vehicles in Household
In terms of no vehicles in household, the demographic groups most similar to Immigrants from North Macedonia are Immigrants from Eritrea (10.6%, a difference of 0.23%), Immigrants from Northern Europe (10.7%, a difference of 0.23%), Carpatho Rusyn (10.7%, a difference of 0.38%), Immigrants from Armenia (10.6%, a difference of 0.42%), and Immigrants from Poland (10.6%, a difference of 0.54%).
| Demographics | Rating | Rank | No Vehicles in Household |
| Natives/Alaskans | 43.7 /100 | #183 | Average 10.5% |
| Immigrants | Nepal | 42.4 /100 | #184 | Average 10.5% |
| South Americans | 41.9 /100 | #185 | Average 10.5% |
| German Russians | 40.6 /100 | #186 | Average 10.5% |
| Immigrants | Poland | 38.4 /100 | #187 | Fair 10.6% |
| Immigrants | Armenia | 37.5 /100 | #188 | Fair 10.6% |
| Immigrants | Eritrea | 36.3 /100 | #189 | Fair 10.6% |
| Immigrants | North Macedonia | 34.6 /100 | #190 | Fair 10.6% |
| Immigrants | Northern Europe | 33.1 /100 | #191 | Fair 10.7% |
| Carpatho Rusyns | 32.1 /100 | #192 | Fair 10.7% |
| Ukrainians | 28.0 /100 | #193 | Fair 10.7% |
| Pueblo | 27.0 /100 | #194 | Fair 10.8% |
| Immigrants | Brazil | 26.3 /100 | #195 | Fair 10.8% |
| Central Americans | 24.3 /100 | #196 | Fair 10.8% |
| Shoshone | 24.1 /100 | #197 | Fair 10.8% |
Demographics Similar to Immigrants from Morocco by No Vehicles in Household
In terms of no vehicles in household, the demographic groups most similar to Immigrants from Morocco are Immigrants from Northern Africa (12.6%, a difference of 0.12%), Panamanian (12.5%, a difference of 0.67%), Immigrants from Africa (12.5%, a difference of 0.80%), Immigrants from Europe (12.5%, a difference of 0.85%), and Bermudan (12.8%, a difference of 1.3%).
| Demographics | Rating | Rank | No Vehicles in Household |
| Immigrants | Switzerland | 0.5 /100 | #264 | Tragic 12.3% |
| Africans | 0.4 /100 | #265 | Tragic 12.3% |
| Israelis | 0.3 /100 | #266 | Tragic 12.4% |
| Immigrants | Europe | 0.3 /100 | #267 | Tragic 12.5% |
| Immigrants | Africa | 0.2 /100 | #268 | Tragic 12.5% |
| Panamanians | 0.2 /100 | #269 | Tragic 12.5% |
| Immigrants | Northern Africa | 0.2 /100 | #270 | Tragic 12.6% |
| Immigrants | Morocco | 0.2 /100 | #271 | Tragic 12.6% |
| Bermudans | 0.1 /100 | #272 | Tragic 12.8% |
| Immigrants | France | 0.1 /100 | #273 | Tragic 12.9% |
| Immigrants | Singapore | 0.1 /100 | #274 | Tragic 12.9% |
| Immigrants | Albania | 0.1 /100 | #275 | Tragic 13.0% |
| Immigrants | Southern Europe | 0.1 /100 | #276 | Tragic 13.0% |
| Aleuts | 0.1 /100 | #277 | Tragic 13.0% |
| Immigrants | Croatia | 0.1 /100 | #278 | Tragic 13.0% |