Black/African American vs Immigrants from Morocco No Schooling Completed
COMPARE
Black/African American
Immigrants from Morocco
No Schooling Completed
No Schooling Completed Comparison
Blacks/African Americans
Immigrants from Morocco
2.1%
NO SCHOOLING COMPLETED
41.4/ 100
METRIC RATING
183rd/ 347
METRIC RANK
2.3%
NO SCHOOLING COMPLETED
8.7/ 100
METRIC RATING
212th/ 347
METRIC RANK
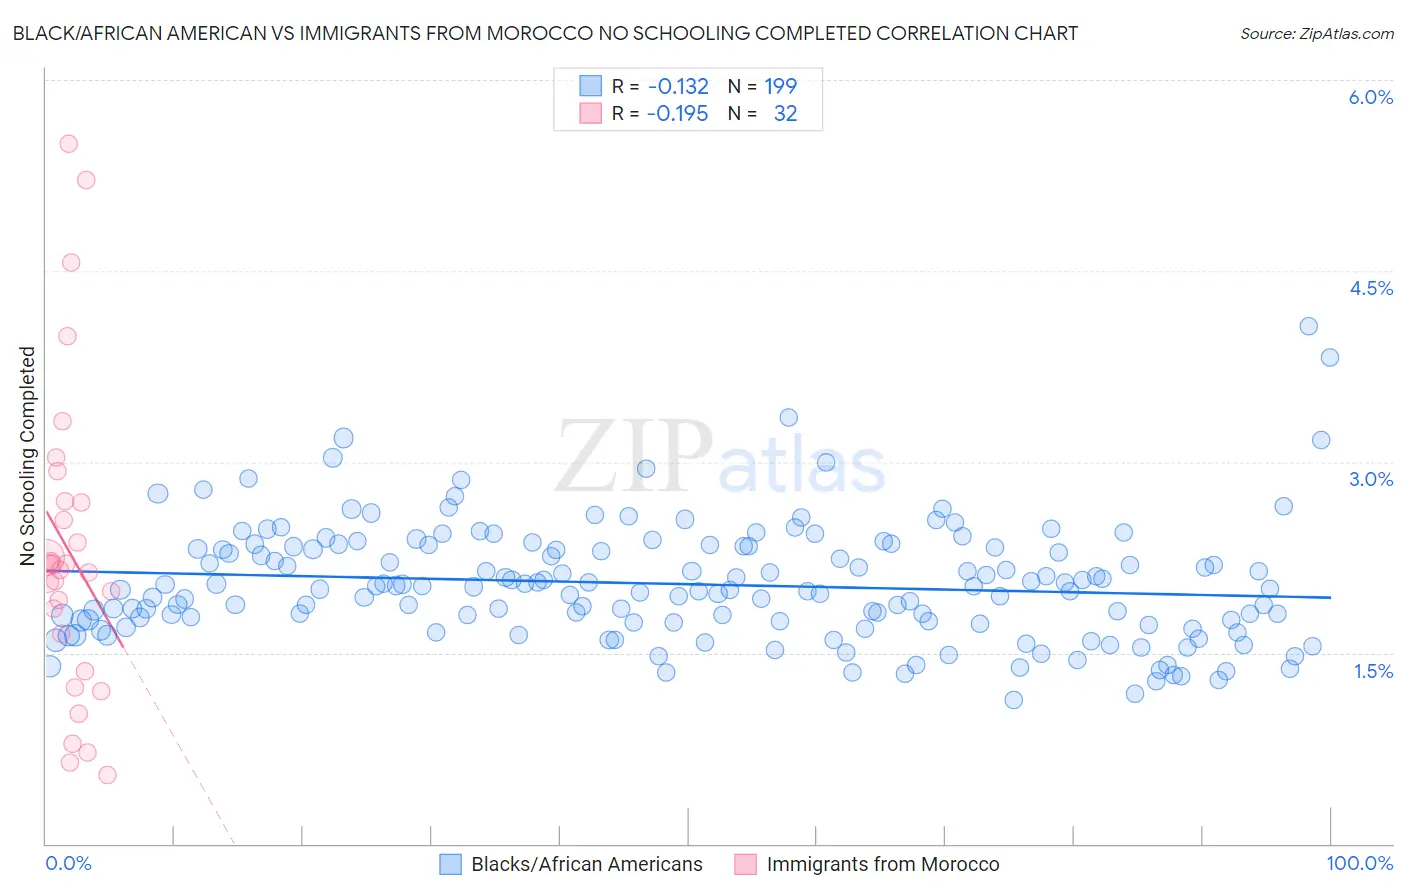
Black/African American vs Immigrants from Morocco No Schooling Completed Correlation Chart
The statistical analysis conducted on geographies consisting of 551,024,391 people shows a poor negative correlation between the proportion of Blacks/African Americans and percentage of population with no schooling in the United States with a correlation coefficient (R) of -0.132 and weighted average of 2.1%. Similarly, the statistical analysis conducted on geographies consisting of 178,575,563 people shows a poor negative correlation between the proportion of Immigrants from Morocco and percentage of population with no schooling in the United States with a correlation coefficient (R) of -0.195 and weighted average of 2.3%, a difference of 6.7%.
No Schooling Completed Correlation Summary
| Measurement | Black/African American | Immigrants from Morocco |
| Minimum | 1.1% | 0.54% |
| Maximum | 4.1% | 5.5% |
| Range | 2.9% | 5.0% |
| Mean | 2.0% | 2.3% |
| Median | 2.0% | 2.2% |
| Interquartile 25% (IQ1) | 1.7% | 1.5% |
| Interquartile 75% (IQ3) | 2.3% | 2.7% |
| Interquartile Range (IQR) | 0.59% | 1.2% |
| Standard Deviation (Sample) | 0.46% | 1.2% |
| Standard Deviation (Population) | 0.46% | 1.2% |
Similar Demographics by No Schooling Completed
Demographics Similar to Blacks/African Americans by No Schooling Completed
In terms of no schooling completed, the demographic groups most similar to Blacks/African Americans are Pima (2.1%, a difference of 0.020%), Mongolian (2.1%, a difference of 0.090%), French American Indian (2.1%, a difference of 0.10%), Immigrants from Taiwan (2.1%, a difference of 0.15%), and Portuguese (2.1%, a difference of 0.33%).
| Demographics | Rating | Rank | No Schooling Completed |
| Panamanians | 45.2 /100 | #176 | Average 2.1% |
| Arapaho | 45.0 /100 | #177 | Average 2.1% |
| Pakistanis | 44.7 /100 | #178 | Average 2.1% |
| Immigrants | Kazakhstan | 44.3 /100 | #179 | Average 2.1% |
| Portuguese | 43.9 /100 | #180 | Average 2.1% |
| Immigrants | Taiwan | 42.6 /100 | #181 | Average 2.1% |
| French American Indians | 42.2 /100 | #182 | Average 2.1% |
| Blacks/African Americans | 41.4 /100 | #183 | Average 2.1% |
| Pima | 41.3 /100 | #184 | Average 2.1% |
| Mongolians | 40.8 /100 | #185 | Average 2.1% |
| Immigrants | Bosnia and Herzegovina | 38.6 /100 | #186 | Fair 2.1% |
| Navajo | 36.5 /100 | #187 | Fair 2.1% |
| Immigrants | Kenya | 36.2 /100 | #188 | Fair 2.1% |
| Immigrants | Egypt | 36.1 /100 | #189 | Fair 2.1% |
| Spanish Americans | 32.6 /100 | #190 | Fair 2.1% |
Demographics Similar to Immigrants from Morocco by No Schooling Completed
In terms of no schooling completed, the demographic groups most similar to Immigrants from Morocco are Immigrants from Panama (2.3%, a difference of 0.010%), Ute (2.3%, a difference of 0.19%), Samoan (2.3%, a difference of 0.23%), Native/Alaskan (2.2%, a difference of 0.46%), and Immigrants from Oceania (2.2%, a difference of 0.54%).
| Demographics | Rating | Rank | No Schooling Completed |
| Immigrants | Bahamas | 11.6 /100 | #205 | Poor 2.2% |
| Bahamians | 11.6 /100 | #206 | Poor 2.2% |
| South American Indians | 11.0 /100 | #207 | Poor 2.2% |
| Uruguayans | 11.0 /100 | #208 | Poor 2.2% |
| Immigrants | Oceania | 10.2 /100 | #209 | Poor 2.2% |
| Natives/Alaskans | 10.0 /100 | #210 | Tragic 2.2% |
| Immigrants | Panama | 8.8 /100 | #211 | Tragic 2.3% |
| Immigrants | Morocco | 8.7 /100 | #212 | Tragic 2.3% |
| Ute | 8.2 /100 | #213 | Tragic 2.3% |
| Samoans | 8.2 /100 | #214 | Tragic 2.3% |
| Immigrants | Zaire | 7.2 /100 | #215 | Tragic 2.3% |
| Tongans | 6.8 /100 | #216 | Tragic 2.3% |
| Immigrants | Syria | 6.6 /100 | #217 | Tragic 2.3% |
| Immigrants | Nepal | 6.4 /100 | #218 | Tragic 2.3% |
| Senegalese | 5.6 /100 | #219 | Tragic 2.3% |