Potawatomi vs Immigrants from Morocco No Vehicles in Household
COMPARE
Potawatomi
Immigrants from Morocco
No Vehicles in Household
No Vehicles in Household Comparison
Potawatomi
Immigrants from Morocco
8.8%
NO VEHICLES IN HOUSEHOLD
98.8/ 100
METRIC RATING
95th/ 347
METRIC RANK
12.6%
NO VEHICLES IN HOUSEHOLD
0.2/ 100
METRIC RATING
271st/ 347
METRIC RANK
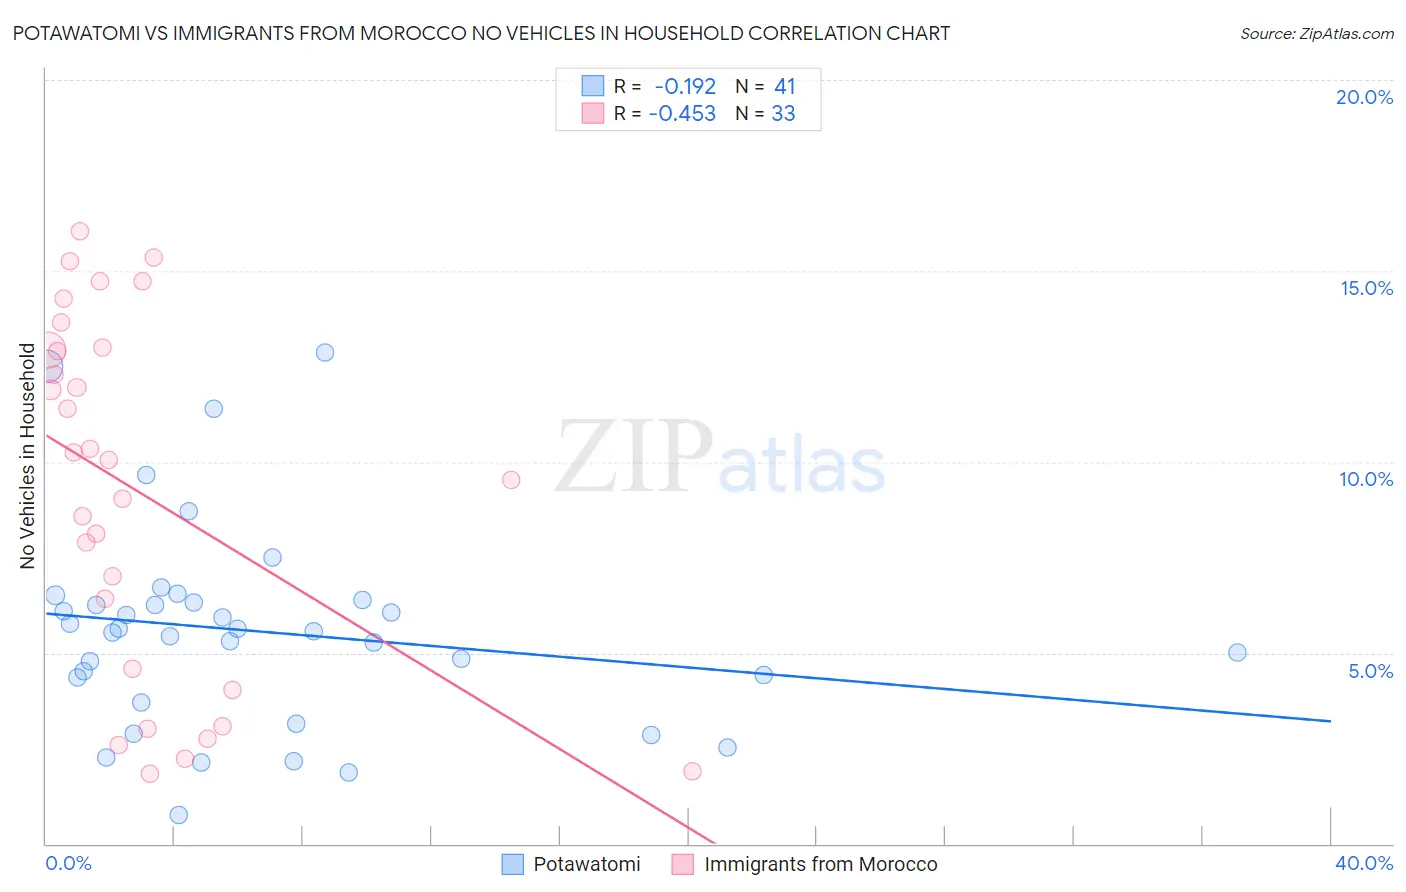
Potawatomi vs Immigrants from Morocco No Vehicles in Household Correlation Chart
The statistical analysis conducted on geographies consisting of 117,640,545 people shows a poor negative correlation between the proportion of Potawatomi and percentage of households with no vehicle available in the United States with a correlation coefficient (R) of -0.192 and weighted average of 8.8%. Similarly, the statistical analysis conducted on geographies consisting of 178,744,032 people shows a moderate negative correlation between the proportion of Immigrants from Morocco and percentage of households with no vehicle available in the United States with a correlation coefficient (R) of -0.453 and weighted average of 12.6%, a difference of 42.7%.
No Vehicles in Household Correlation Summary
| Measurement | Potawatomi | Immigrants from Morocco |
| Minimum | 0.76% | 1.8% |
| Maximum | 12.9% | 16.0% |
| Range | 12.1% | 14.2% |
| Mean | 5.6% | 9.2% |
| Median | 5.6% | 10.0% |
| Interquartile 25% (IQ1) | 4.0% | 4.3% |
| Interquartile 75% (IQ3) | 6.3% | 13.0% |
| Interquartile Range (IQR) | 2.3% | 8.7% |
| Standard Deviation (Sample) | 2.7% | 4.6% |
| Standard Deviation (Population) | 2.6% | 4.6% |
Similar Demographics by No Vehicles in Household
Demographics Similar to Potawatomi by No Vehicles in Household
In terms of no vehicles in household, the demographic groups most similar to Potawatomi are Austrian (8.8%, a difference of 0.14%), Immigrants from Bolivia (8.9%, a difference of 0.28%), Immigrants from Central America (8.9%, a difference of 0.94%), Immigrants from North America (8.7%, a difference of 1.1%), and Immigrants from Canada (8.7%, a difference of 1.2%).
| Demographics | Rating | Rank | No Vehicles in Household |
| Osage | 99.2 /100 | #88 | Exceptional 8.7% |
| Immigrants | Cuba | 99.2 /100 | #89 | Exceptional 8.7% |
| Bhutanese | 99.2 /100 | #90 | Exceptional 8.7% |
| Immigrants | Germany | 99.1 /100 | #91 | Exceptional 8.7% |
| Immigrants | Canada | 99.1 /100 | #92 | Exceptional 8.7% |
| Immigrants | North America | 99.1 /100 | #93 | Exceptional 8.7% |
| Austrians | 98.9 /100 | #94 | Exceptional 8.8% |
| Potawatomi | 98.8 /100 | #95 | Exceptional 8.8% |
| Immigrants | Bolivia | 98.7 /100 | #96 | Exceptional 8.9% |
| Immigrants | Central America | 98.5 /100 | #97 | Exceptional 8.9% |
| Slavs | 98.4 /100 | #98 | Exceptional 9.0% |
| Bulgarians | 98.4 /100 | #99 | Exceptional 9.0% |
| Asians | 98.3 /100 | #100 | Exceptional 9.0% |
| Pakistanis | 98.3 /100 | #101 | Exceptional 9.0% |
| Yugoslavians | 98.3 /100 | #102 | Exceptional 9.0% |
Demographics Similar to Immigrants from Morocco by No Vehicles in Household
In terms of no vehicles in household, the demographic groups most similar to Immigrants from Morocco are Immigrants from Northern Africa (12.6%, a difference of 0.12%), Panamanian (12.5%, a difference of 0.67%), Immigrants from Africa (12.5%, a difference of 0.80%), Immigrants from Europe (12.5%, a difference of 0.85%), and Bermudan (12.8%, a difference of 1.3%).
| Demographics | Rating | Rank | No Vehicles in Household |
| Immigrants | Switzerland | 0.5 /100 | #264 | Tragic 12.3% |
| Africans | 0.4 /100 | #265 | Tragic 12.3% |
| Israelis | 0.3 /100 | #266 | Tragic 12.4% |
| Immigrants | Europe | 0.3 /100 | #267 | Tragic 12.5% |
| Immigrants | Africa | 0.2 /100 | #268 | Tragic 12.5% |
| Panamanians | 0.2 /100 | #269 | Tragic 12.5% |
| Immigrants | Northern Africa | 0.2 /100 | #270 | Tragic 12.6% |
| Immigrants | Morocco | 0.2 /100 | #271 | Tragic 12.6% |
| Bermudans | 0.1 /100 | #272 | Tragic 12.8% |
| Immigrants | France | 0.1 /100 | #273 | Tragic 12.9% |
| Immigrants | Singapore | 0.1 /100 | #274 | Tragic 12.9% |
| Immigrants | Albania | 0.1 /100 | #275 | Tragic 13.0% |
| Immigrants | Southern Europe | 0.1 /100 | #276 | Tragic 13.0% |
| Aleuts | 0.1 /100 | #277 | Tragic 13.0% |
| Immigrants | Croatia | 0.1 /100 | #278 | Tragic 13.0% |