Belizean vs Iranian 4 or more Vehicles in Household
COMPARE
Belizean
Iranian
4 or more Vehicles in Household
4 or more Vehicles in Household Comparison
Belizeans
Iranians
6.3%
4 OR MORE VEHICLES IN HOUSEHOLD
44.5/ 100
METRIC RATING
178th/ 347
METRIC RANK
6.5%
4 OR MORE VEHICLES IN HOUSEHOLD
69.9/ 100
METRIC RATING
156th/ 347
METRIC RANK
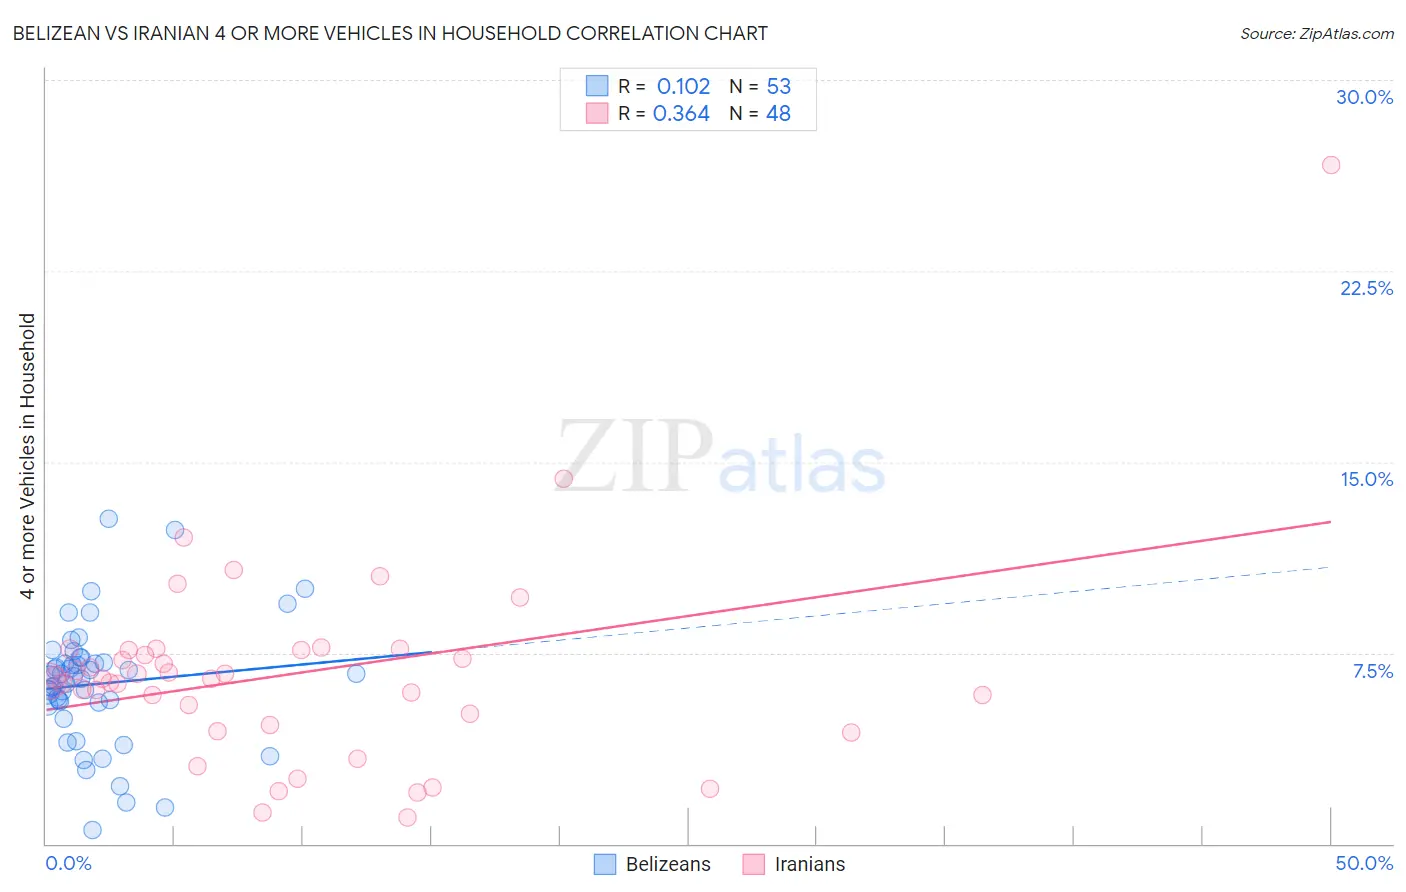
Belizean vs Iranian 4 or more Vehicles in Household Correlation Chart
The statistical analysis conducted on geographies consisting of 143,595,749 people shows a poor positive correlation between the proportion of Belizeans and percentage of households with 4 or more vehicles available in the United States with a correlation coefficient (R) of 0.102 and weighted average of 6.3%. Similarly, the statistical analysis conducted on geographies consisting of 315,200,253 people shows a mild positive correlation between the proportion of Iranians and percentage of households with 4 or more vehicles available in the United States with a correlation coefficient (R) of 0.364 and weighted average of 6.5%, a difference of 2.7%.
4 or more Vehicles in Household Correlation Summary
| Measurement | Belizean | Iranian |
| Minimum | 0.54% | 1.1% |
| Maximum | 12.8% | 26.7% |
| Range | 12.2% | 25.6% |
| Mean | 6.3% | 6.7% |
| Median | 6.6% | 6.5% |
| Interquartile 25% (IQ1) | 5.5% | 4.9% |
| Interquartile 75% (IQ3) | 7.2% | 7.6% |
| Interquartile Range (IQR) | 1.7% | 2.7% |
| Standard Deviation (Sample) | 2.4% | 4.0% |
| Standard Deviation (Population) | 2.4% | 4.0% |
Similar Demographics by 4 or more Vehicles in Household
Demographics Similar to Belizeans by 4 or more Vehicles in Household
In terms of 4 or more vehicles in household, the demographic groups most similar to Belizeans are Immigrants from Japan (6.3%, a difference of 0.15%), Slovak (6.3%, a difference of 0.24%), Syrian (6.3%, a difference of 0.27%), Ukrainian (6.3%, a difference of 0.31%), and Yugoslavian (6.3%, a difference of 0.35%).
| Demographics | Rating | Rank | 4 or more Vehicles in Household |
| Immigrants | India | 51.9 /100 | #171 | Average 6.3% |
| Immigrants | Lebanon | 51.7 /100 | #172 | Average 6.3% |
| Slovenes | 51.1 /100 | #173 | Average 6.3% |
| Lithuanians | 50.0 /100 | #174 | Average 6.3% |
| Immigrants | Western Europe | 48.8 /100 | #175 | Average 6.3% |
| Ukrainians | 47.6 /100 | #176 | Average 6.3% |
| Slovaks | 46.9 /100 | #177 | Average 6.3% |
| Belizeans | 44.5 /100 | #178 | Average 6.3% |
| Immigrants | Japan | 43.1 /100 | #179 | Average 6.3% |
| Syrians | 42.0 /100 | #180 | Average 6.3% |
| Yugoslavians | 41.1 /100 | #181 | Average 6.3% |
| South American Indians | 40.7 /100 | #182 | Average 6.3% |
| Immigrants | Burma/Myanmar | 37.5 /100 | #183 | Fair 6.2% |
| Iraqis | 37.3 /100 | #184 | Fair 6.2% |
| Thais | 36.9 /100 | #185 | Fair 6.2% |
Demographics Similar to Iranians by 4 or more Vehicles in Household
In terms of 4 or more vehicles in household, the demographic groups most similar to Iranians are Peruvian (6.5%, a difference of 0.050%), Iroquois (6.5%, a difference of 0.060%), Central American Indian (6.5%, a difference of 0.14%), Immigrants from Armenia (6.5%, a difference of 0.16%), and Yuman (6.5%, a difference of 0.27%).
| Demographics | Rating | Rank | 4 or more Vehicles in Household |
| Greeks | 73.6 /100 | #149 | Good 6.5% |
| New Zealanders | 73.3 /100 | #150 | Good 6.5% |
| Immigrants | Hong Kong | 72.2 /100 | #151 | Good 6.5% |
| Yuman | 72.1 /100 | #152 | Good 6.5% |
| Immigrants | Armenia | 71.2 /100 | #153 | Good 6.5% |
| Central American Indians | 71.1 /100 | #154 | Good 6.5% |
| Iroquois | 70.4 /100 | #155 | Good 6.5% |
| Iranians | 69.9 /100 | #156 | Good 6.5% |
| Peruvians | 69.4 /100 | #157 | Good 6.5% |
| Zimbabweans | 67.1 /100 | #158 | Good 6.4% |
| Indians (Asian) | 66.3 /100 | #159 | Good 6.4% |
| Palestinians | 65.8 /100 | #160 | Good 6.4% |
| Immigrants | Cameroon | 64.4 /100 | #161 | Good 6.4% |
| Immigrants | Pakistan | 63.2 /100 | #162 | Good 6.4% |
| Chileans | 61.2 /100 | #163 | Good 6.4% |