Belgian vs Immigrants from Oceania Unemployment Among Women with Children Under 6 years
COMPARE
Belgian
Immigrants from Oceania
Unemployment Among Women with Children Under 6 years
Unemployment Among Women with Children Under 6 years Comparison
Belgians
Immigrants from Oceania
7.6%
UNEMPLOYMENT AMONG WOMEN WITH CHILDREN UNDER 6 YEARS
63.5/ 100
METRIC RATING
166th/ 347
METRIC RANK
7.5%
UNEMPLOYMENT AMONG WOMEN WITH CHILDREN UNDER 6 YEARS
78.4/ 100
METRIC RATING
147th/ 347
METRIC RANK
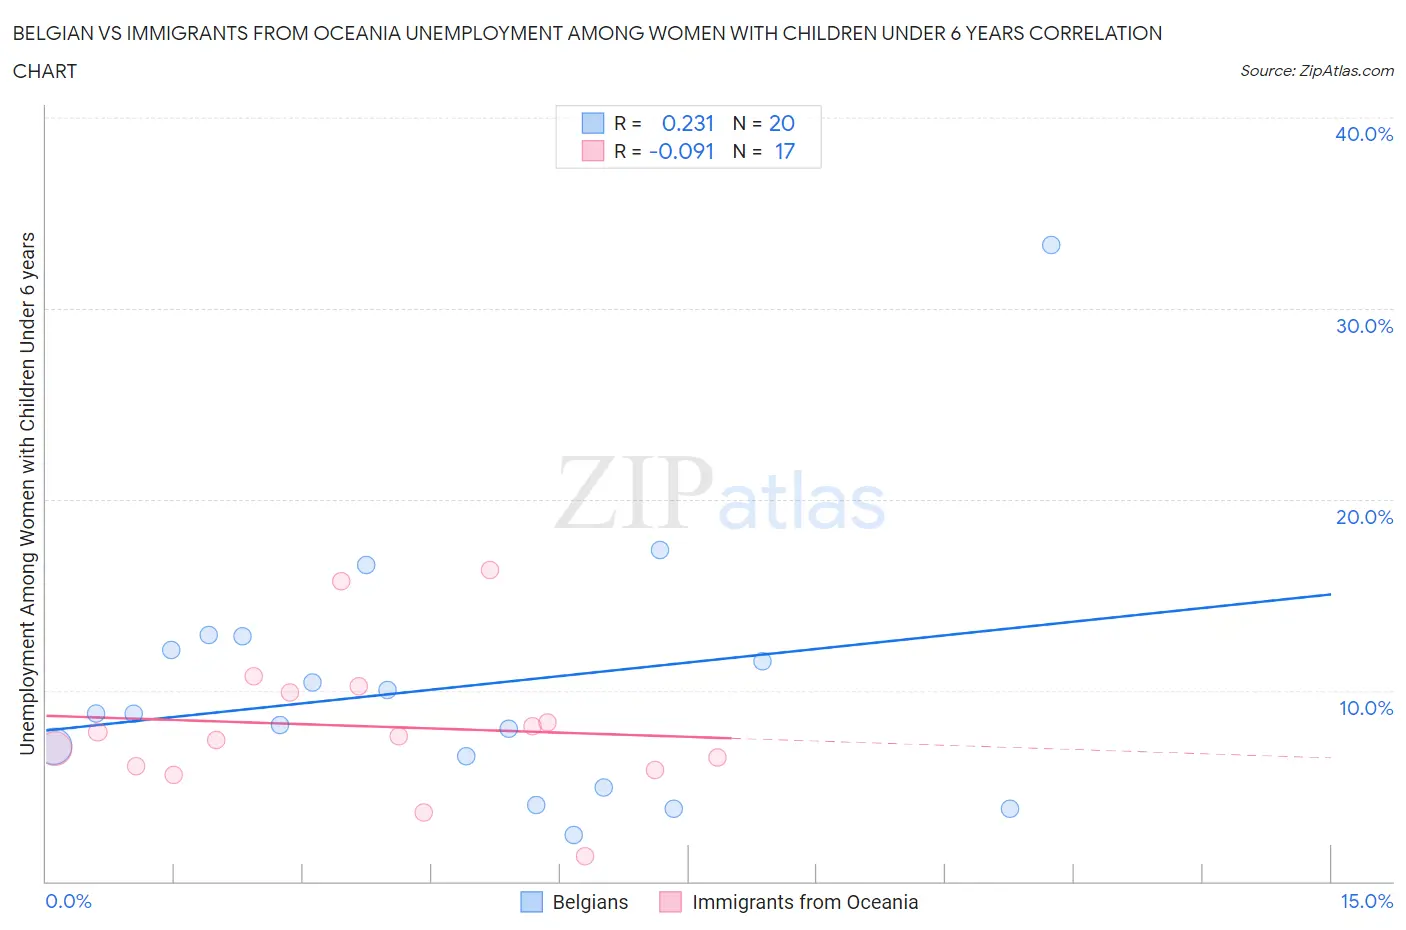
Belgian vs Immigrants from Oceania Unemployment Among Women with Children Under 6 years Correlation Chart
The statistical analysis conducted on geographies consisting of 265,159,177 people shows a weak positive correlation between the proportion of Belgians and unemployment rate among women with children under the age of 6 in the United States with a correlation coefficient (R) of 0.231 and weighted average of 7.6%. Similarly, the statistical analysis conducted on geographies consisting of 243,645,085 people shows a slight negative correlation between the proportion of Immigrants from Oceania and unemployment rate among women with children under the age of 6 in the United States with a correlation coefficient (R) of -0.091 and weighted average of 7.5%, a difference of 1.3%.
Unemployment Among Women with Children Under 6 years Correlation Summary
| Measurement | Belgian | Immigrants from Oceania |
| Minimum | 2.4% | 1.3% |
| Maximum | 33.3% | 16.3% |
| Range | 30.9% | 15.0% |
| Mean | 10.2% | 8.1% |
| Median | 8.8% | 7.6% |
| Interquartile 25% (IQ1) | 5.7% | 5.9% |
| Interquartile 75% (IQ3) | 12.5% | 10.1% |
| Interquartile Range (IQR) | 6.7% | 4.2% |
| Standard Deviation (Sample) | 6.8% | 3.8% |
| Standard Deviation (Population) | 6.7% | 3.7% |
Demographics Similar to Belgians and Immigrants from Oceania by Unemployment Among Women with Children Under 6 years
In terms of unemployment among women with children under 6 years, the demographic groups most similar to Belgians are Immigrants from South America (7.6%, a difference of 0.15%), Ugandan (7.6%, a difference of 0.17%), British (7.6%, a difference of 0.21%), Immigrants from Lithuania (7.5%, a difference of 0.40%), and Immigrants from Western Asia (7.5%, a difference of 0.51%). Similarly, the demographic groups most similar to Immigrants from Oceania are Japanese (7.5%, a difference of 0.050%), Immigrants from Brazil (7.5%, a difference of 0.11%), Colombian (7.5%, a difference of 0.22%), Aleut (7.5%, a difference of 0.23%), and Immigrants from Peru (7.5%, a difference of 0.33%).
| Demographics | Rating | Rank | Unemployment Among Women with Children Under 6 years |
| Japanese | 78.9 /100 | #146 | Good 7.5% |
| Immigrants | Oceania | 78.4 /100 | #147 | Good 7.5% |
| Immigrants | Brazil | 77.3 /100 | #148 | Good 7.5% |
| Colombians | 76.1 /100 | #149 | Good 7.5% |
| Aleuts | 76.0 /100 | #150 | Good 7.5% |
| Immigrants | Peru | 74.9 /100 | #151 | Good 7.5% |
| Bangladeshis | 74.8 /100 | #152 | Good 7.5% |
| Uruguayans | 74.7 /100 | #153 | Good 7.5% |
| Northern Europeans | 74.3 /100 | #154 | Good 7.5% |
| South Americans | 74.1 /100 | #155 | Good 7.5% |
| Immigrants | Southern Europe | 73.2 /100 | #156 | Good 7.5% |
| Peruvians | 72.3 /100 | #157 | Good 7.5% |
| Croatians | 71.9 /100 | #158 | Good 7.5% |
| Immigrants | Philippines | 71.3 /100 | #159 | Good 7.5% |
| Bolivians | 70.8 /100 | #160 | Good 7.5% |
| Immigrants | Western Asia | 70.2 /100 | #161 | Good 7.5% |
| Immigrants | Lithuania | 68.8 /100 | #162 | Good 7.5% |
| British | 66.3 /100 | #163 | Good 7.6% |
| Ugandans | 65.8 /100 | #164 | Good 7.6% |
| Immigrants | South America | 65.6 /100 | #165 | Good 7.6% |
| Belgians | 63.5 /100 | #166 | Good 7.6% |