Australian vs Nigerian No Schooling Completed
COMPARE
Australian
Nigerian
No Schooling Completed
No Schooling Completed Comparison
Australians
Nigerians
1.6%
NO SCHOOLING COMPLETED
99.9/ 100
METRIC RATING
43rd/ 347
METRIC RANK
2.3%
NO SCHOOLING COMPLETED
2.6/ 100
METRIC RATING
234th/ 347
METRIC RANK
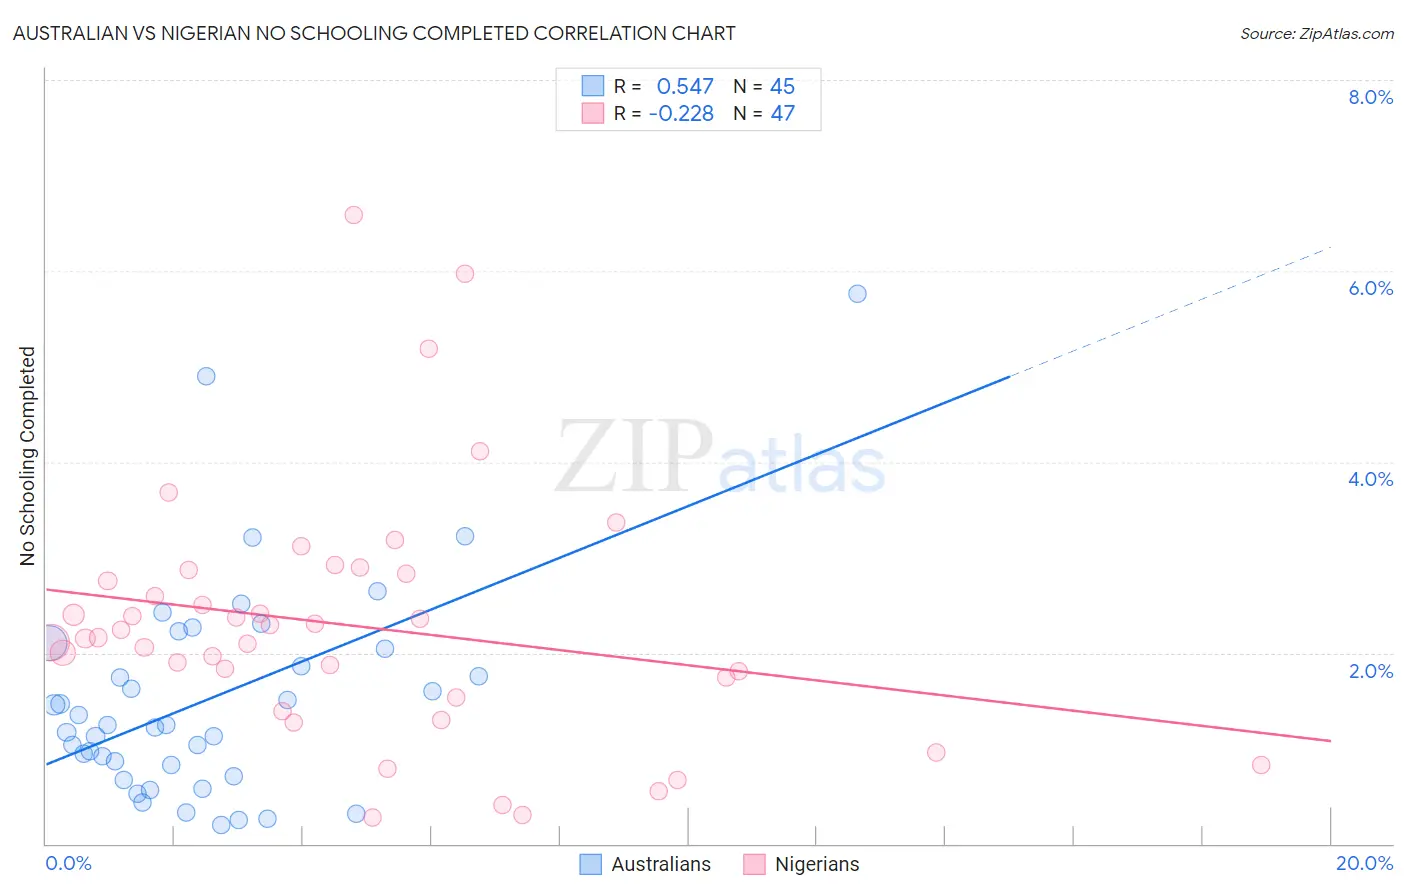
Australian vs Nigerian No Schooling Completed Correlation Chart
The statistical analysis conducted on geographies consisting of 222,453,601 people shows a substantial positive correlation between the proportion of Australians and percentage of population with no schooling in the United States with a correlation coefficient (R) of 0.547 and weighted average of 1.6%. Similarly, the statistical analysis conducted on geographies consisting of 330,931,802 people shows a weak negative correlation between the proportion of Nigerians and percentage of population with no schooling in the United States with a correlation coefficient (R) of -0.228 and weighted average of 2.3%, a difference of 45.0%.
No Schooling Completed Correlation Summary
| Measurement | Australian | Nigerian |
| Minimum | 0.20% | 0.27% |
| Maximum | 5.8% | 6.6% |
| Range | 5.6% | 6.3% |
| Mean | 1.5% | 2.3% |
| Median | 1.2% | 2.2% |
| Interquartile 25% (IQ1) | 0.77% | 1.5% |
| Interquartile 75% (IQ3) | 2.1% | 2.8% |
| Interquartile Range (IQR) | 1.3% | 1.3% |
| Standard Deviation (Sample) | 1.1% | 1.3% |
| Standard Deviation (Population) | 1.1% | 1.3% |
Similar Demographics by No Schooling Completed
Demographics Similar to Australians by No Schooling Completed
In terms of no schooling completed, the demographic groups most similar to Australians are Bulgarian (1.6%, a difference of 0.12%), Estonian (1.6%, a difference of 0.19%), Czechoslovakian (1.6%, a difference of 0.23%), Maltese (1.6%, a difference of 0.32%), and Ottawa (1.6%, a difference of 0.47%).
| Demographics | Rating | Rank | No Schooling Completed |
| Aleuts | 99.9 /100 | #36 | Exceptional 1.6% |
| Belgians | 99.9 /100 | #37 | Exceptional 1.6% |
| Northern Europeans | 99.9 /100 | #38 | Exceptional 1.6% |
| Native Hawaiians | 99.9 /100 | #39 | Exceptional 1.6% |
| Luxembourgers | 99.9 /100 | #40 | Exceptional 1.6% |
| Hungarians | 99.9 /100 | #41 | Exceptional 1.6% |
| Bulgarians | 99.9 /100 | #42 | Exceptional 1.6% |
| Australians | 99.9 /100 | #43 | Exceptional 1.6% |
| Estonians | 99.9 /100 | #44 | Exceptional 1.6% |
| Czechoslovakians | 99.9 /100 | #45 | Exceptional 1.6% |
| Maltese | 99.9 /100 | #46 | Exceptional 1.6% |
| Ottawa | 99.9 /100 | #47 | Exceptional 1.6% |
| Immigrants | Scotland | 99.9 /100 | #48 | Exceptional 1.6% |
| Whites/Caucasians | 99.9 /100 | #49 | Exceptional 1.6% |
| Celtics | 99.9 /100 | #50 | Exceptional 1.6% |
Demographics Similar to Nigerians by No Schooling Completed
In terms of no schooling completed, the demographic groups most similar to Nigerians are Immigrants from Western Asia (2.3%, a difference of 0.020%), Immigrants from Malaysia (2.3%, a difference of 0.25%), Iraqi (2.4%, a difference of 0.56%), Colombian (2.3%, a difference of 0.61%), and Immigrants from Eastern Asia (2.4%, a difference of 0.76%).
| Demographics | Rating | Rank | No Schooling Completed |
| Immigrants | Uganda | 4.0 /100 | #227 | Tragic 2.3% |
| U.S. Virgin Islanders | 3.7 /100 | #228 | Tragic 2.3% |
| Immigrants | Pakistan | 3.6 /100 | #229 | Tragic 2.3% |
| Puerto Ricans | 3.4 /100 | #230 | Tragic 2.3% |
| Immigrants | Uruguay | 3.4 /100 | #231 | Tragic 2.3% |
| Colombians | 3.2 /100 | #232 | Tragic 2.3% |
| Immigrants | Malaysia | 2.8 /100 | #233 | Tragic 2.3% |
| Nigerians | 2.6 /100 | #234 | Tragic 2.3% |
| Immigrants | Western Asia | 2.6 /100 | #235 | Tragic 2.3% |
| Iraqis | 2.2 /100 | #236 | Tragic 2.4% |
| Immigrants | Eastern Asia | 2.0 /100 | #237 | Tragic 2.4% |
| Paiute | 1.9 /100 | #238 | Tragic 2.4% |
| Liberians | 1.8 /100 | #239 | Tragic 2.4% |
| Immigrants | Senegal | 1.7 /100 | #240 | Tragic 2.4% |
| Koreans | 1.7 /100 | #241 | Tragic 2.4% |