Australian vs Immigrants from Syria Vision Disability
COMPARE
Australian
Immigrants from Syria
Vision Disability
Vision Disability Comparison
Australians
Immigrants from Syria
2.1%
VISION DISABILITY
95.9/ 100
METRIC RATING
95th/ 347
METRIC RANK
2.1%
VISION DISABILITY
96.2/ 100
METRIC RATING
92nd/ 347
METRIC RANK
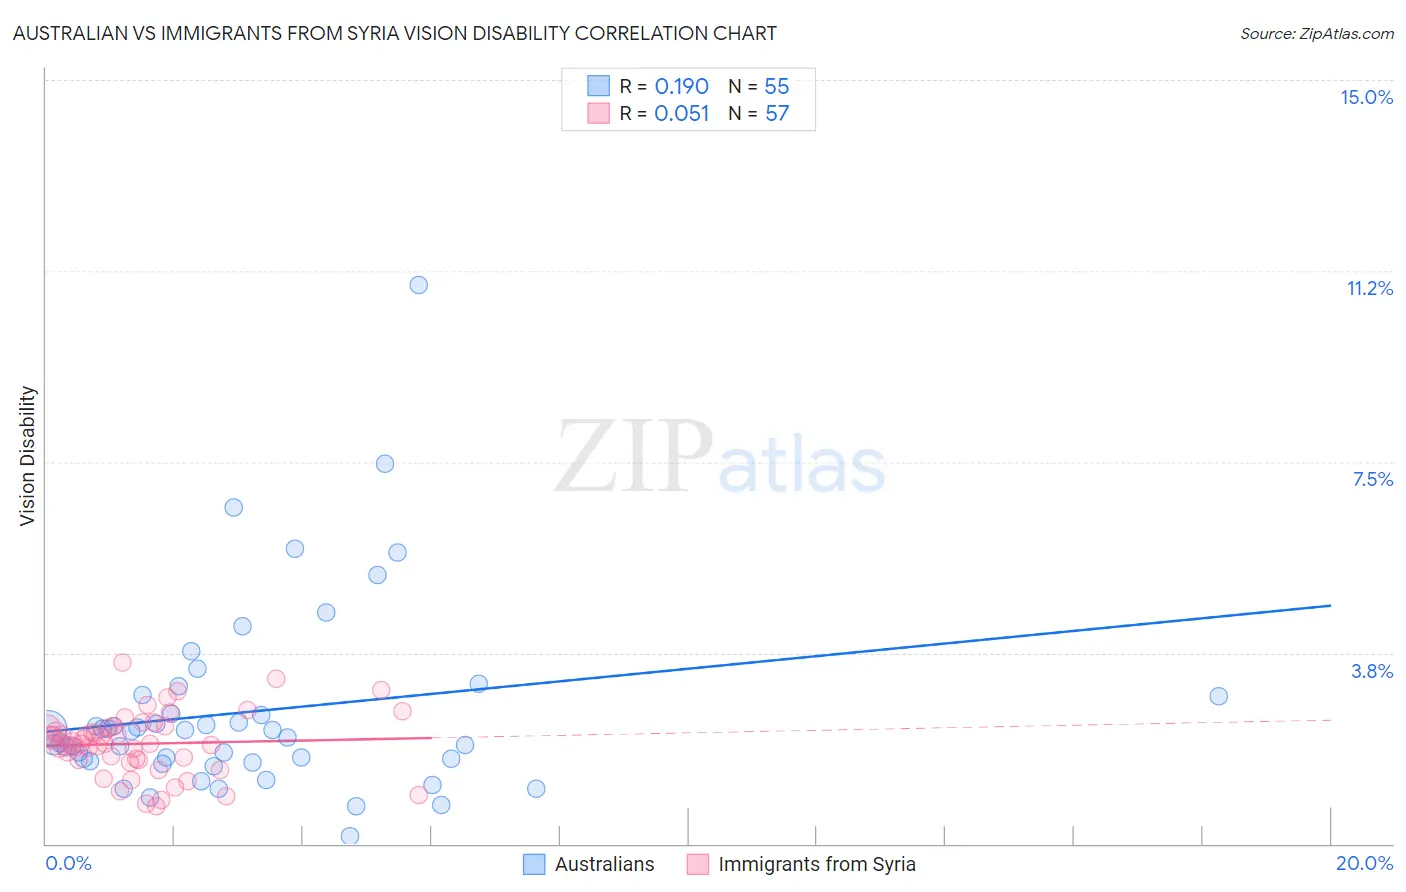
Australian vs Immigrants from Syria Vision Disability Correlation Chart
The statistical analysis conducted on geographies consisting of 224,056,870 people shows a poor positive correlation between the proportion of Australians and percentage of population with vision disability in the United States with a correlation coefficient (R) of 0.190 and weighted average of 2.1%. Similarly, the statistical analysis conducted on geographies consisting of 174,077,138 people shows a slight positive correlation between the proportion of Immigrants from Syria and percentage of population with vision disability in the United States with a correlation coefficient (R) of 0.051 and weighted average of 2.1%, a difference of 0.14%.
Vision Disability Correlation Summary
| Measurement | Australian | Immigrants from Syria |
| Minimum | 0.16% | 0.73% |
| Maximum | 11.0% | 3.6% |
| Range | 10.8% | 2.8% |
| Mean | 2.6% | 2.0% |
| Median | 2.2% | 2.0% |
| Interquartile 25% (IQ1) | 1.6% | 1.6% |
| Interquartile 75% (IQ3) | 2.9% | 2.3% |
| Interquartile Range (IQR) | 1.3% | 0.65% |
| Standard Deviation (Sample) | 1.9% | 0.61% |
| Standard Deviation (Population) | 1.8% | 0.61% |
Demographics Similar to Australians and Immigrants from Syria by Vision Disability
In terms of vision disability, the demographic groups most similar to Australians are Romanian (2.1%, a difference of 0.060%), Immigrants from Croatia (2.1%, a difference of 0.070%), Immigrants from Europe (2.1%, a difference of 0.090%), Immigrants from Afghanistan (2.1%, a difference of 0.13%), and Immigrants from Somalia (2.1%, a difference of 0.16%). Similarly, the demographic groups most similar to Immigrants from Syria are Immigrants from Somalia (2.1%, a difference of 0.020%), Immigrants from Europe (2.1%, a difference of 0.050%), Immigrants from Croatia (2.1%, a difference of 0.070%), Romanian (2.1%, a difference of 0.20%), and Immigrants from Lebanon (2.1%, a difference of 0.24%).
| Demographics | Rating | Rank | Vision Disability |
| Immigrants | Western Asia | 97.5 /100 | #83 | Exceptional 2.0% |
| Immigrants | Latvia | 97.3 /100 | #84 | Exceptional 2.0% |
| Chinese | 97.2 /100 | #85 | Exceptional 2.0% |
| Immigrants | Moldova | 97.2 /100 | #86 | Exceptional 2.0% |
| Immigrants | Switzerland | 97.0 /100 | #87 | Exceptional 2.0% |
| Norwegians | 97.0 /100 | #88 | Exceptional 2.0% |
| Immigrants | Eastern Africa | 97.0 /100 | #89 | Exceptional 2.0% |
| Immigrants | Lebanon | 96.7 /100 | #90 | Exceptional 2.1% |
| Immigrants | Somalia | 96.2 /100 | #91 | Exceptional 2.1% |
| Immigrants | Syria | 96.2 /100 | #92 | Exceptional 2.1% |
| Immigrants | Europe | 96.1 /100 | #93 | Exceptional 2.1% |
| Immigrants | Croatia | 96.0 /100 | #94 | Exceptional 2.1% |
| Australians | 95.9 /100 | #95 | Exceptional 2.1% |
| Romanians | 95.7 /100 | #96 | Exceptional 2.1% |
| Immigrants | Afghanistan | 95.6 /100 | #97 | Exceptional 2.1% |
| Immigrants | South Africa | 95.4 /100 | #98 | Exceptional 2.1% |
| Estonians | 95.3 /100 | #99 | Exceptional 2.1% |
| Greeks | 95.1 /100 | #100 | Exceptional 2.1% |
| Albanians | 94.9 /100 | #101 | Exceptional 2.1% |
| Sri Lankans | 94.8 /100 | #102 | Exceptional 2.1% |
| Immigrants | Austria | 94.4 /100 | #103 | Exceptional 2.1% |