Australian vs Immigrants from Syria Disability Age Over 75
COMPARE
Australian
Immigrants from Syria
Disability Age Over 75
Disability Age Over 75 Comparison
Australians
Immigrants from Syria
45.7%
DISABILITY AGE OVER 75
99.8/ 100
METRIC RATING
44th/ 347
METRIC RANK
47.8%
DISABILITY AGE OVER 75
17.4/ 100
METRIC RATING
207th/ 347
METRIC RANK
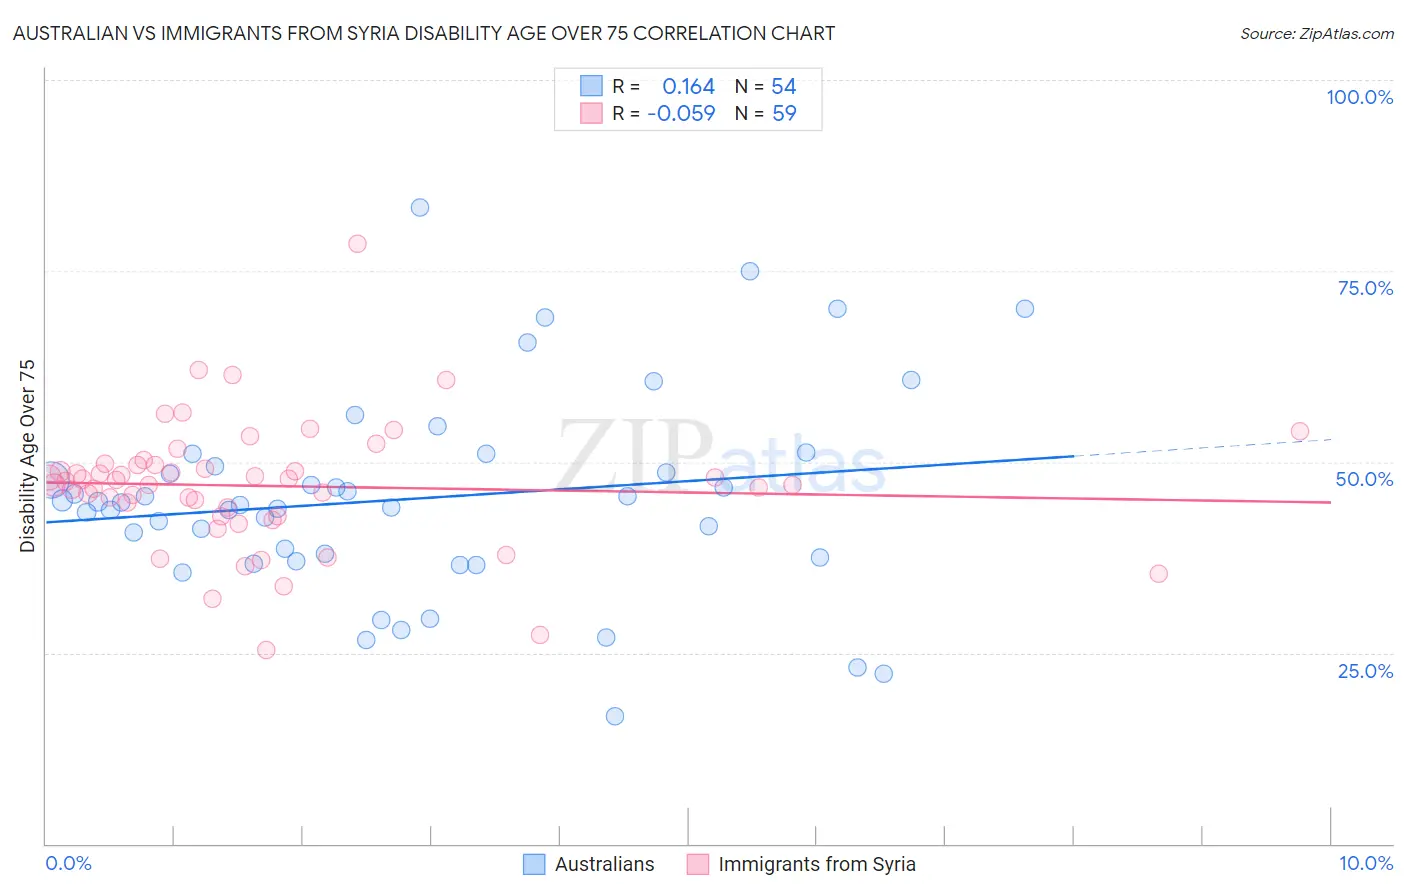
Australian vs Immigrants from Syria Disability Age Over 75 Correlation Chart
The statistical analysis conducted on geographies consisting of 223,885,741 people shows a poor positive correlation between the proportion of Australians and percentage of population with a disability over the age of 75 in the United States with a correlation coefficient (R) of 0.164 and weighted average of 45.7%. Similarly, the statistical analysis conducted on geographies consisting of 174,043,785 people shows a slight negative correlation between the proportion of Immigrants from Syria and percentage of population with a disability over the age of 75 in the United States with a correlation coefficient (R) of -0.059 and weighted average of 47.8%, a difference of 4.6%.
Disability Age Over 75 Correlation Summary
| Measurement | Australian | Immigrants from Syria |
| Minimum | 16.7% | 25.4% |
| Maximum | 83.3% | 78.6% |
| Range | 66.7% | 53.1% |
| Mean | 45.2% | 46.8% |
| Median | 44.5% | 47.5% |
| Interquartile 25% (IQ1) | 37.5% | 42.8% |
| Interquartile 75% (IQ3) | 49.4% | 49.6% |
| Interquartile Range (IQR) | 11.9% | 6.8% |
| Standard Deviation (Sample) | 13.3% | 8.4% |
| Standard Deviation (Population) | 13.1% | 8.3% |
Similar Demographics by Disability Age Over 75
Demographics Similar to Australians by Disability Age Over 75
In terms of disability age over 75, the demographic groups most similar to Australians are Turkish (45.7%, a difference of 0.0%), Swedish (45.7%, a difference of 0.030%), Greek (45.6%, a difference of 0.040%), Czech (45.7%, a difference of 0.040%), and Immigrants from Canada (45.7%, a difference of 0.040%).
| Demographics | Rating | Rank | Disability Age Over 75 |
| South Africans | 99.9 /100 | #37 | Exceptional 45.5% |
| Italians | 99.9 /100 | #38 | Exceptional 45.6% |
| Estonians | 99.9 /100 | #39 | Exceptional 45.6% |
| Slovenes | 99.9 /100 | #40 | Exceptional 45.6% |
| Immigrants | Singapore | 99.8 /100 | #41 | Exceptional 45.6% |
| Greeks | 99.8 /100 | #42 | Exceptional 45.6% |
| Czechs | 99.8 /100 | #43 | Exceptional 45.7% |
| Australians | 99.8 /100 | #44 | Exceptional 45.7% |
| Turks | 99.8 /100 | #45 | Exceptional 45.7% |
| Swedes | 99.8 /100 | #46 | Exceptional 45.7% |
| Immigrants | Canada | 99.8 /100 | #47 | Exceptional 45.7% |
| Croatians | 99.8 /100 | #48 | Exceptional 45.7% |
| Immigrants | North America | 99.8 /100 | #49 | Exceptional 45.7% |
| Belgians | 99.7 /100 | #50 | Exceptional 45.8% |
| Immigrants | Korea | 99.7 /100 | #51 | Exceptional 45.8% |
Demographics Similar to Immigrants from Syria by Disability Age Over 75
In terms of disability age over 75, the demographic groups most similar to Immigrants from Syria are Immigrants from Senegal (47.8%, a difference of 0.020%), Immigrants from Ghana (47.7%, a difference of 0.060%), Jamaican (47.7%, a difference of 0.060%), Nigerian (47.7%, a difference of 0.070%), and Trinidadian and Tobagonian (47.7%, a difference of 0.10%).
| Demographics | Rating | Rank | Disability Age Over 75 |
| Immigrants | Somalia | 21.4 /100 | #200 | Fair 47.7% |
| Immigrants | Cuba | 20.9 /100 | #201 | Fair 47.7% |
| Immigrants | Bahamas | 20.7 /100 | #202 | Fair 47.7% |
| Trinidadians and Tobagonians | 20.0 /100 | #203 | Fair 47.7% |
| Nigerians | 19.2 /100 | #204 | Poor 47.7% |
| Immigrants | Ghana | 19.1 /100 | #205 | Poor 47.7% |
| Jamaicans | 19.0 /100 | #206 | Poor 47.7% |
| Immigrants | Syria | 17.4 /100 | #207 | Poor 47.8% |
| Immigrants | Senegal | 16.9 /100 | #208 | Poor 47.8% |
| Immigrants | Indonesia | 14.2 /100 | #209 | Poor 47.8% |
| Vietnamese | 11.9 /100 | #210 | Poor 47.9% |
| Panamanians | 11.8 /100 | #211 | Poor 47.9% |
| Immigrants | Burma/Myanmar | 11.7 /100 | #212 | Poor 47.9% |
| Laotians | 11.5 /100 | #213 | Poor 47.9% |
| Immigrants | Barbados | 10.7 /100 | #214 | Poor 47.9% |