Immigrants from Eritrea vs Immigrants from Syria 2 or more Vehicles in Household
COMPARE
Immigrants from Eritrea
Immigrants from Syria
2 or more Vehicles in Household
2 or more Vehicles in Household Comparison
Immigrants from Eritrea
Immigrants from Syria
52.6%
2 OR MORE VEHICLES IN HOUSEHOLD
0.7/ 100
METRIC RATING
256th/ 347
METRIC RANK
56.2%
2 OR MORE VEHICLES IN HOUSEHOLD
81.4/ 100
METRIC RATING
144th/ 347
METRIC RANK
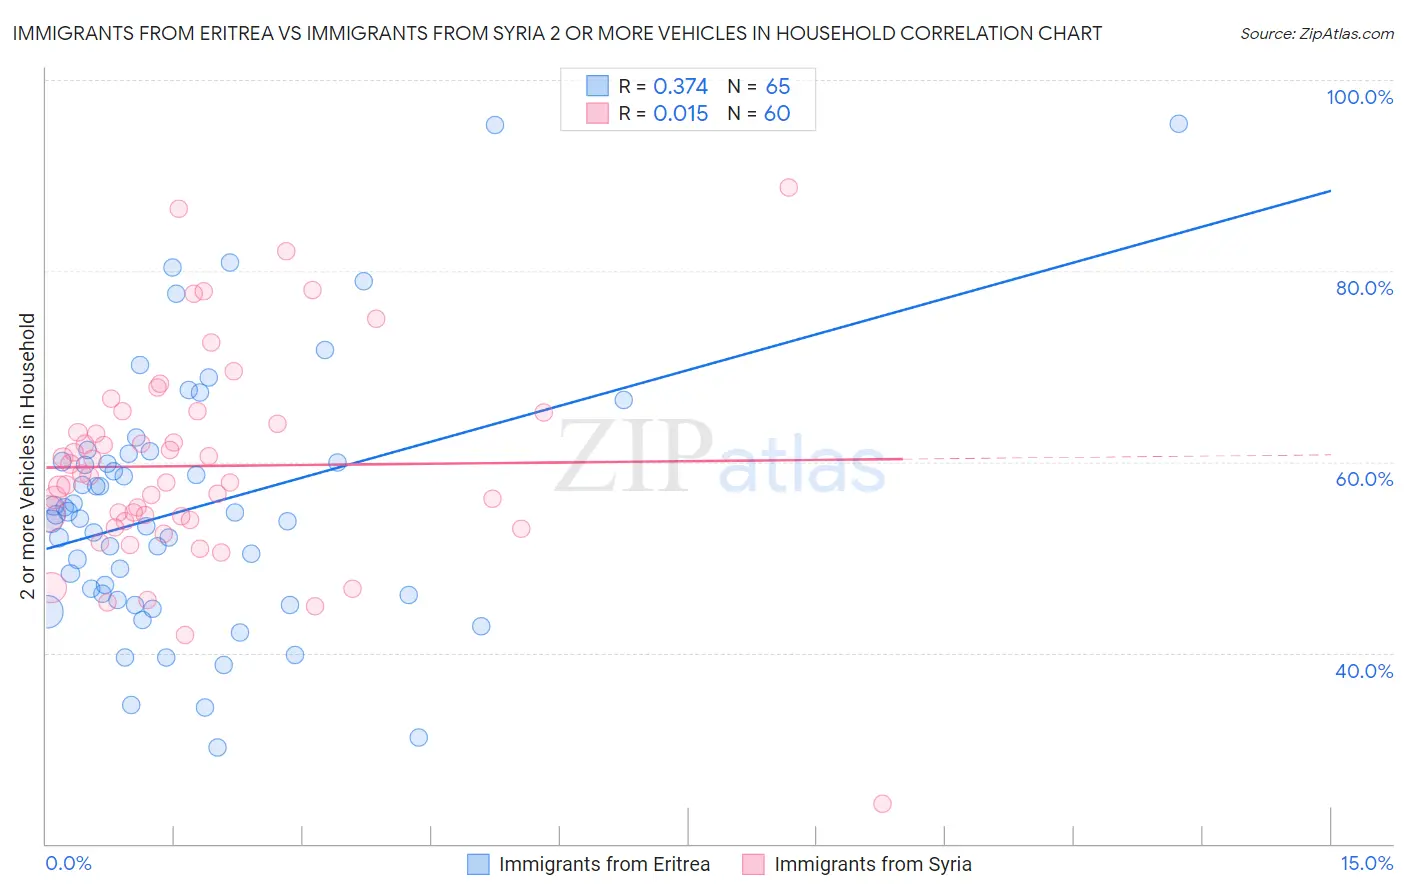
Immigrants from Eritrea vs Immigrants from Syria 2 or more Vehicles in Household Correlation Chart
The statistical analysis conducted on geographies consisting of 104,847,164 people shows a mild positive correlation between the proportion of Immigrants from Eritrea and percentage of households with 2 or more vehicles available in the United States with a correlation coefficient (R) of 0.374 and weighted average of 52.6%. Similarly, the statistical analysis conducted on geographies consisting of 174,033,758 people shows no correlation between the proportion of Immigrants from Syria and percentage of households with 2 or more vehicles available in the United States with a correlation coefficient (R) of 0.015 and weighted average of 56.2%, a difference of 6.7%.
2 or more Vehicles in Household Correlation Summary
| Measurement | Immigrants from Eritrea | Immigrants from Syria |
| Minimum | 30.0% | 24.2% |
| Maximum | 95.5% | 88.7% |
| Range | 65.4% | 64.5% |
| Mean | 55.1% | 59.6% |
| Median | 54.0% | 58.2% |
| Interquartile 25% (IQ1) | 45.8% | 53.8% |
| Interquartile 75% (IQ3) | 60.5% | 64.6% |
| Interquartile Range (IQR) | 14.7% | 10.8% |
| Standard Deviation (Sample) | 13.5% | 11.0% |
| Standard Deviation (Population) | 13.4% | 10.9% |
Similar Demographics by 2 or more Vehicles in Household
Demographics Similar to Immigrants from Eritrea by 2 or more Vehicles in Household
In terms of 2 or more vehicles in household, the demographic groups most similar to Immigrants from Eritrea are Uruguayan (52.7%, a difference of 0.040%), Immigrants from Malaysia (52.7%, a difference of 0.070%), Immigrants from Hong Kong (52.6%, a difference of 0.14%), Central American Indian (52.5%, a difference of 0.24%), and Nigerian (52.8%, a difference of 0.26%).
| Demographics | Rating | Rank | 2 or more Vehicles in Household |
| Immigrants | Brazil | 1.0 /100 | #249 | Tragic 52.8% |
| Mongolians | 1.0 /100 | #250 | Tragic 52.8% |
| Immigrants | Sudan | 1.0 /100 | #251 | Tragic 52.8% |
| Immigrants | Portugal | 1.0 /100 | #252 | Tragic 52.8% |
| Nigerians | 0.9 /100 | #253 | Tragic 52.8% |
| Immigrants | Malaysia | 0.8 /100 | #254 | Tragic 52.7% |
| Uruguayans | 0.7 /100 | #255 | Tragic 52.7% |
| Immigrants | Eritrea | 0.7 /100 | #256 | Tragic 52.6% |
| Immigrants | Hong Kong | 0.6 /100 | #257 | Tragic 52.6% |
| Central American Indians | 0.6 /100 | #258 | Tragic 52.5% |
| Alsatians | 0.6 /100 | #259 | Tragic 52.5% |
| Immigrants | Bahamas | 0.5 /100 | #260 | Tragic 52.5% |
| Immigrants | Australia | 0.5 /100 | #261 | Tragic 52.4% |
| Immigrants | Northern Africa | 0.4 /100 | #262 | Tragic 52.3% |
| Immigrants | Southern Europe | 0.4 /100 | #263 | Tragic 52.3% |
Demographics Similar to Immigrants from Syria by 2 or more Vehicles in Household
In terms of 2 or more vehicles in household, the demographic groups most similar to Immigrants from Syria are Syrian (56.2%, a difference of 0.010%), Seminole (56.2%, a difference of 0.020%), Venezuelan (56.1%, a difference of 0.050%), Serbian (56.1%, a difference of 0.070%), and Immigrants from Moldova (56.1%, a difference of 0.070%).
| Demographics | Rating | Rank | 2 or more Vehicles in Household |
| Cubans | 84.8 /100 | #137 | Excellent 56.3% |
| Salvadorans | 84.7 /100 | #138 | Excellent 56.3% |
| Armenians | 84.3 /100 | #139 | Excellent 56.3% |
| Latvians | 83.6 /100 | #140 | Excellent 56.2% |
| Immigrants | Cambodia | 83.6 /100 | #141 | Excellent 56.2% |
| South Africans | 83.1 /100 | #142 | Excellent 56.2% |
| Seminole | 81.7 /100 | #143 | Excellent 56.2% |
| Immigrants | Syria | 81.4 /100 | #144 | Excellent 56.2% |
| Syrians | 81.2 /100 | #145 | Excellent 56.2% |
| Venezuelans | 80.7 /100 | #146 | Excellent 56.1% |
| Serbians | 80.3 /100 | #147 | Excellent 56.1% |
| Immigrants | Moldova | 80.2 /100 | #148 | Excellent 56.1% |
| Chileans | 80.2 /100 | #149 | Excellent 56.1% |
| Nicaraguans | 79.9 /100 | #150 | Good 56.1% |
| Immigrants | Northern Europe | 78.7 /100 | #151 | Good 56.1% |