Australian vs Asian Unemployment Among Ages 20 to 24 years
COMPARE
Australian
Asian
Unemployment Among Ages 20 to 24 years
Unemployment Among Ages 20 to 24 years Comparison
Australians
Asians
9.6%
UNEMPLOYMENT AMONG AGES 20 TO 24 YEARS
100.0/ 100
METRIC RATING
33rd/ 347
METRIC RANK
10.2%
UNEMPLOYMENT AMONG AGES 20 TO 24 YEARS
77.7/ 100
METRIC RATING
146th/ 347
METRIC RANK
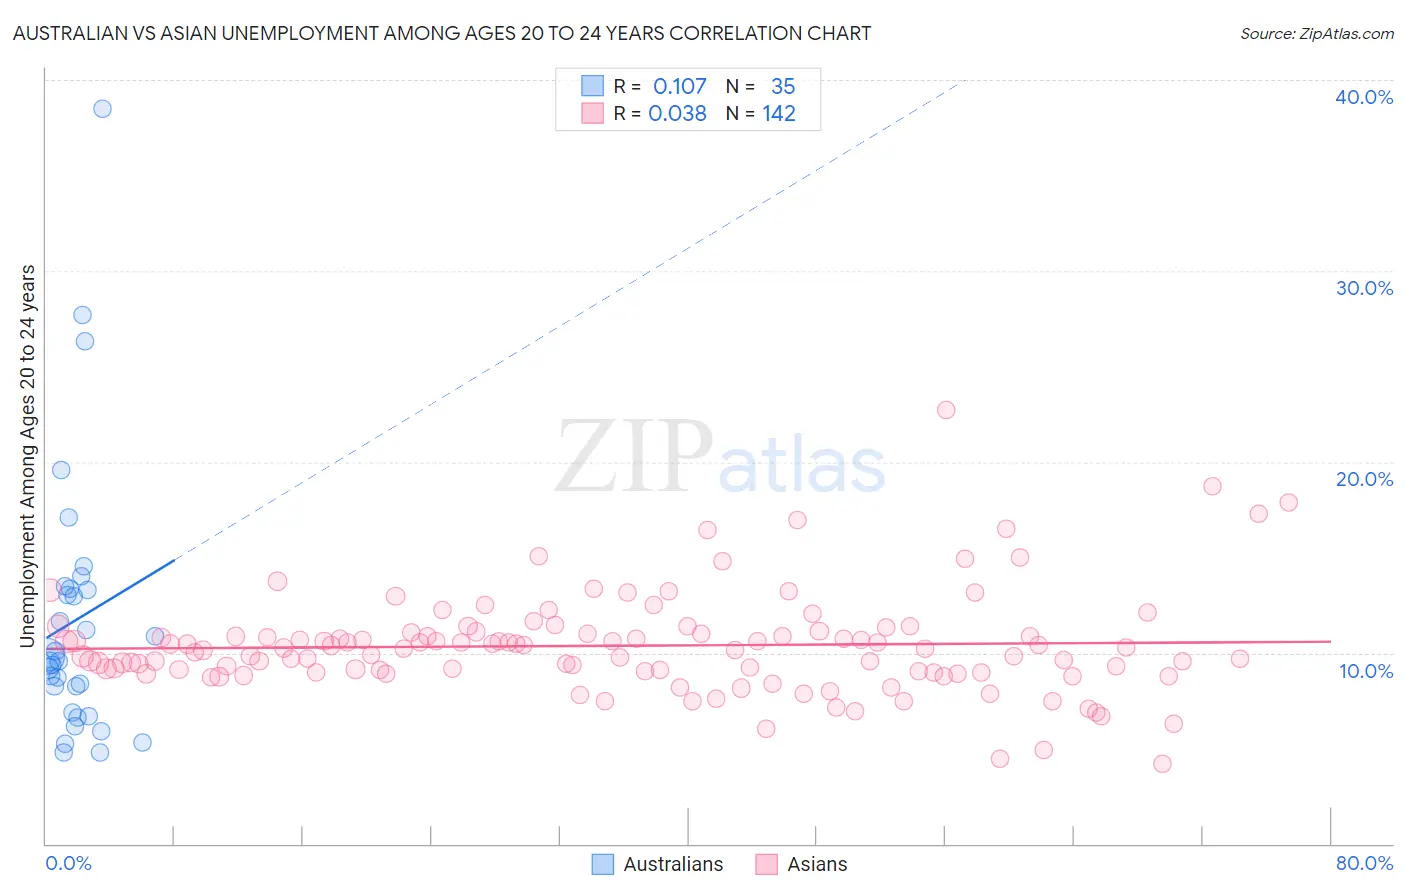
Australian vs Asian Unemployment Among Ages 20 to 24 years Correlation Chart
The statistical analysis conducted on geographies consisting of 219,577,245 people shows a poor positive correlation between the proportion of Australians and unemployment rate among population between the ages 20 and 24 in the United States with a correlation coefficient (R) of 0.107 and weighted average of 9.6%. Similarly, the statistical analysis conducted on geographies consisting of 513,970,712 people shows no correlation between the proportion of Asians and unemployment rate among population between the ages 20 and 24 in the United States with a correlation coefficient (R) of 0.038 and weighted average of 10.2%, a difference of 6.7%.
Unemployment Among Ages 20 to 24 years Correlation Summary
| Measurement | Australian | Asian |
| Minimum | 4.7% | 4.2% |
| Maximum | 38.5% | 22.7% |
| Range | 33.8% | 18.5% |
| Mean | 11.7% | 10.4% |
| Median | 9.6% | 10.2% |
| Interquartile 25% (IQ1) | 6.9% | 9.0% |
| Interquartile 75% (IQ3) | 13.4% | 11.0% |
| Interquartile Range (IQR) | 6.5% | 2.0% |
| Standard Deviation (Sample) | 7.1% | 2.6% |
| Standard Deviation (Population) | 7.0% | 2.6% |
Similar Demographics by Unemployment Among Ages 20 to 24 years
Demographics Similar to Australians by Unemployment Among Ages 20 to 24 years
In terms of unemployment among ages 20 to 24 years, the demographic groups most similar to Australians are Cambodian (9.5%, a difference of 0.11%), Immigrants from Eastern Africa (9.5%, a difference of 0.16%), Yugoslavian (9.6%, a difference of 0.20%), Scandinavian (9.5%, a difference of 0.24%), and Immigrants from North Macedonia (9.5%, a difference of 0.26%).
| Demographics | Rating | Rank | Unemployment Among Ages 20 to 24 years |
| Swedes | 100.0 /100 | #26 | Exceptional 9.5% |
| Immigrants | Zimbabwe | 100.0 /100 | #27 | Exceptional 9.5% |
| Immigrants | Afghanistan | 100.0 /100 | #28 | Exceptional 9.5% |
| Immigrants | North Macedonia | 100.0 /100 | #29 | Exceptional 9.5% |
| Scandinavians | 100.0 /100 | #30 | Exceptional 9.5% |
| Immigrants | Eastern Africa | 100.0 /100 | #31 | Exceptional 9.5% |
| Cambodians | 100.0 /100 | #32 | Exceptional 9.5% |
| Australians | 100.0 /100 | #33 | Exceptional 9.6% |
| Yugoslavians | 100.0 /100 | #34 | Exceptional 9.6% |
| Germans | 100.0 /100 | #35 | Exceptional 9.6% |
| Belgians | 100.0 /100 | #36 | Exceptional 9.6% |
| Immigrants | Zaire | 100.0 /100 | #37 | Exceptional 9.6% |
| Afghans | 99.9 /100 | #38 | Exceptional 9.6% |
| Dutch | 99.9 /100 | #39 | Exceptional 9.6% |
| Immigrants | Ethiopia | 99.9 /100 | #40 | Exceptional 9.6% |
Demographics Similar to Asians by Unemployment Among Ages 20 to 24 years
In terms of unemployment among ages 20 to 24 years, the demographic groups most similar to Asians are French Canadian (10.2%, a difference of 0.010%), Argentinean (10.2%, a difference of 0.020%), Brazilian (10.2%, a difference of 0.040%), Immigrants from Jordan (10.2%, a difference of 0.070%), and Immigrants from Romania (10.2%, a difference of 0.10%).
| Demographics | Rating | Rank | Unemployment Among Ages 20 to 24 years |
| Uruguayans | 81.9 /100 | #139 | Excellent 10.2% |
| Immigrants | Austria | 81.4 /100 | #140 | Excellent 10.2% |
| Immigrants | Azores | 81.4 /100 | #141 | Excellent 10.2% |
| Slovaks | 80.2 /100 | #142 | Excellent 10.2% |
| Immigrants | Jordan | 79.0 /100 | #143 | Good 10.2% |
| Brazilians | 78.4 /100 | #144 | Good 10.2% |
| Argentineans | 78.0 /100 | #145 | Good 10.2% |
| Asians | 77.7 /100 | #146 | Good 10.2% |
| French Canadians | 77.5 /100 | #147 | Good 10.2% |
| Immigrants | Romania | 75.7 /100 | #148 | Good 10.2% |
| Immigrants | Scotland | 74.6 /100 | #149 | Good 10.2% |
| Hungarians | 74.4 /100 | #150 | Good 10.2% |
| Immigrants | South Africa | 73.6 /100 | #151 | Good 10.2% |
| Iranians | 72.4 /100 | #152 | Good 10.2% |
| Immigrants | Taiwan | 71.4 /100 | #153 | Good 10.2% |