Australian vs Bulgarian 4 or more Vehicles in Household
COMPARE
Australian
Bulgarian
4 or more Vehicles in Household
4 or more Vehicles in Household Comparison
Australians
Bulgarians
6.6%
4 OR MORE VEHICLES IN HOUSEHOLD
80.8/ 100
METRIC RATING
141st/ 347
METRIC RANK
5.8%
4 OR MORE VEHICLES IN HOUSEHOLD
3.1/ 100
METRIC RATING
245th/ 347
METRIC RANK
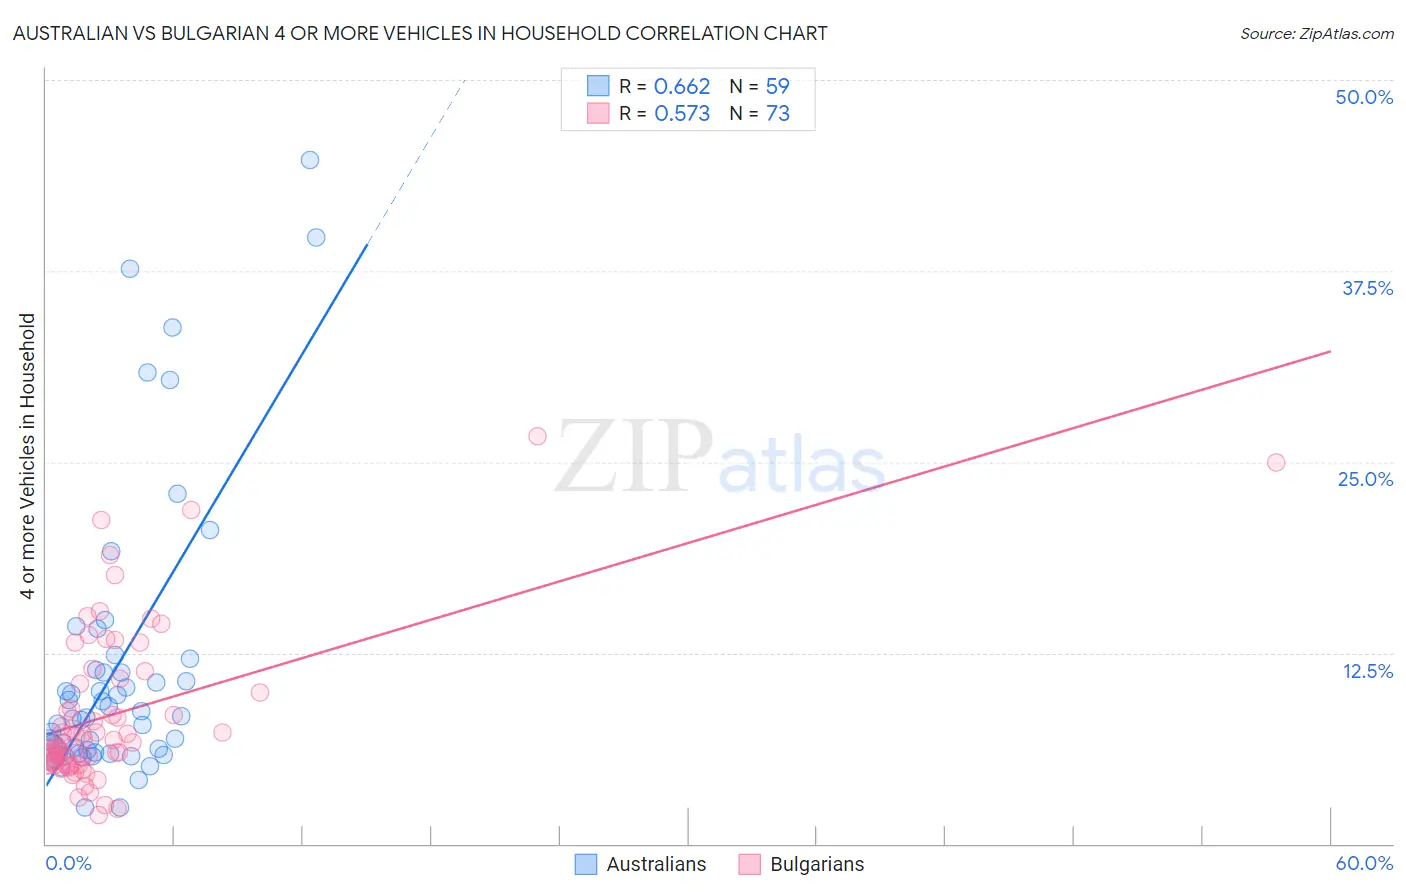
Australian vs Bulgarian 4 or more Vehicles in Household Correlation Chart
The statistical analysis conducted on geographies consisting of 223,029,698 people shows a significant positive correlation between the proportion of Australians and percentage of households with 4 or more vehicles available in the United States with a correlation coefficient (R) of 0.662 and weighted average of 6.6%. Similarly, the statistical analysis conducted on geographies consisting of 205,001,744 people shows a substantial positive correlation between the proportion of Bulgarians and percentage of households with 4 or more vehicles available in the United States with a correlation coefficient (R) of 0.573 and weighted average of 5.8%, a difference of 13.5%.
4 or more Vehicles in Household Correlation Summary
| Measurement | Australian | Bulgarian |
| Minimum | 2.4% | 1.9% |
| Maximum | 44.7% | 26.7% |
| Range | 42.4% | 24.8% |
| Mean | 11.5% | 8.5% |
| Median | 8.3% | 6.7% |
| Interquartile 25% (IQ1) | 6.0% | 5.2% |
| Interquartile 75% (IQ3) | 11.4% | 10.6% |
| Interquartile Range (IQR) | 5.4% | 5.5% |
| Standard Deviation (Sample) | 9.4% | 5.2% |
| Standard Deviation (Population) | 9.3% | 5.2% |
Similar Demographics by 4 or more Vehicles in Household
Demographics Similar to Australians by 4 or more Vehicles in Household
In terms of 4 or more vehicles in household, the demographic groups most similar to Australians are Slavic (6.6%, a difference of 0.13%), Immigrants from Iraq (6.5%, a difference of 0.20%), Jordanian (6.6%, a difference of 0.21%), Immigrants from Canada (6.5%, a difference of 0.33%), and Immigrants from North America (6.5%, a difference of 0.35%).
| Demographics | Rating | Rank | 4 or more Vehicles in Household |
| Ottawa | 86.9 /100 | #134 | Excellent 6.6% |
| Tohono O'odham | 86.7 /100 | #135 | Excellent 6.6% |
| Luxembourgers | 86.4 /100 | #136 | Excellent 6.6% |
| French Canadians | 85.4 /100 | #137 | Excellent 6.6% |
| Italians | 84.5 /100 | #138 | Excellent 6.6% |
| Jordanians | 82.1 /100 | #139 | Excellent 6.6% |
| Slavs | 81.6 /100 | #140 | Excellent 6.6% |
| Australians | 80.8 /100 | #141 | Excellent 6.6% |
| Immigrants | Iraq | 79.4 /100 | #142 | Good 6.5% |
| Immigrants | Canada | 78.6 /100 | #143 | Good 6.5% |
| Immigrants | North America | 78.5 /100 | #144 | Good 6.5% |
| Croatians | 77.8 /100 | #145 | Good 6.5% |
| Immigrants | Costa Rica | 74.4 /100 | #146 | Good 6.5% |
| Immigrants | Iran | 73.9 /100 | #147 | Good 6.5% |
| Immigrants | Jordan | 73.7 /100 | #148 | Good 6.5% |
Demographics Similar to Bulgarians by 4 or more Vehicles in Household
In terms of 4 or more vehicles in household, the demographic groups most similar to Bulgarians are Ethiopian (5.8%, a difference of 0.040%), Immigrants from Czechoslovakia (5.8%, a difference of 0.050%), Immigrants from Middle Africa (5.8%, a difference of 0.24%), Mongolian (5.8%, a difference of 0.45%), and Immigrants from Poland (5.8%, a difference of 0.54%).
| Demographics | Rating | Rank | 4 or more Vehicles in Household |
| Immigrants | Belgium | 4.0 /100 | #238 | Tragic 5.8% |
| Immigrants | Australia | 3.8 /100 | #239 | Tragic 5.8% |
| Immigrants | Poland | 3.8 /100 | #240 | Tragic 5.8% |
| Mongolians | 3.7 /100 | #241 | Tragic 5.8% |
| Immigrants | Middle Africa | 3.4 /100 | #242 | Tragic 5.8% |
| Immigrants | Czechoslovakia | 3.2 /100 | #243 | Tragic 5.8% |
| Ethiopians | 3.2 /100 | #244 | Tragic 5.8% |
| Bulgarians | 3.1 /100 | #245 | Tragic 5.8% |
| Immigrants | North Macedonia | 2.5 /100 | #246 | Tragic 5.7% |
| Immigrants | Ethiopia | 2.4 /100 | #247 | Tragic 5.7% |
| Immigrants | Eastern Africa | 2.4 /100 | #248 | Tragic 5.7% |
| Immigrants | Southern Europe | 2.3 /100 | #249 | Tragic 5.7% |
| Immigrants | Europe | 2.3 /100 | #250 | Tragic 5.7% |
| Ugandans | 2.2 /100 | #251 | Tragic 5.7% |
| Sub-Saharan Africans | 2.1 /100 | #252 | Tragic 5.7% |