Australian vs Macedonian 4 or more Vehicles in Household
COMPARE
Australian
Macedonian
4 or more Vehicles in Household
4 or more Vehicles in Household Comparison
Australians
Macedonians
6.6%
4 OR MORE VEHICLES IN HOUSEHOLD
80.8/ 100
METRIC RATING
141st/ 347
METRIC RANK
5.5%
4 OR MORE VEHICLES IN HOUSEHOLD
0.6/ 100
METRIC RATING
273rd/ 347
METRIC RANK
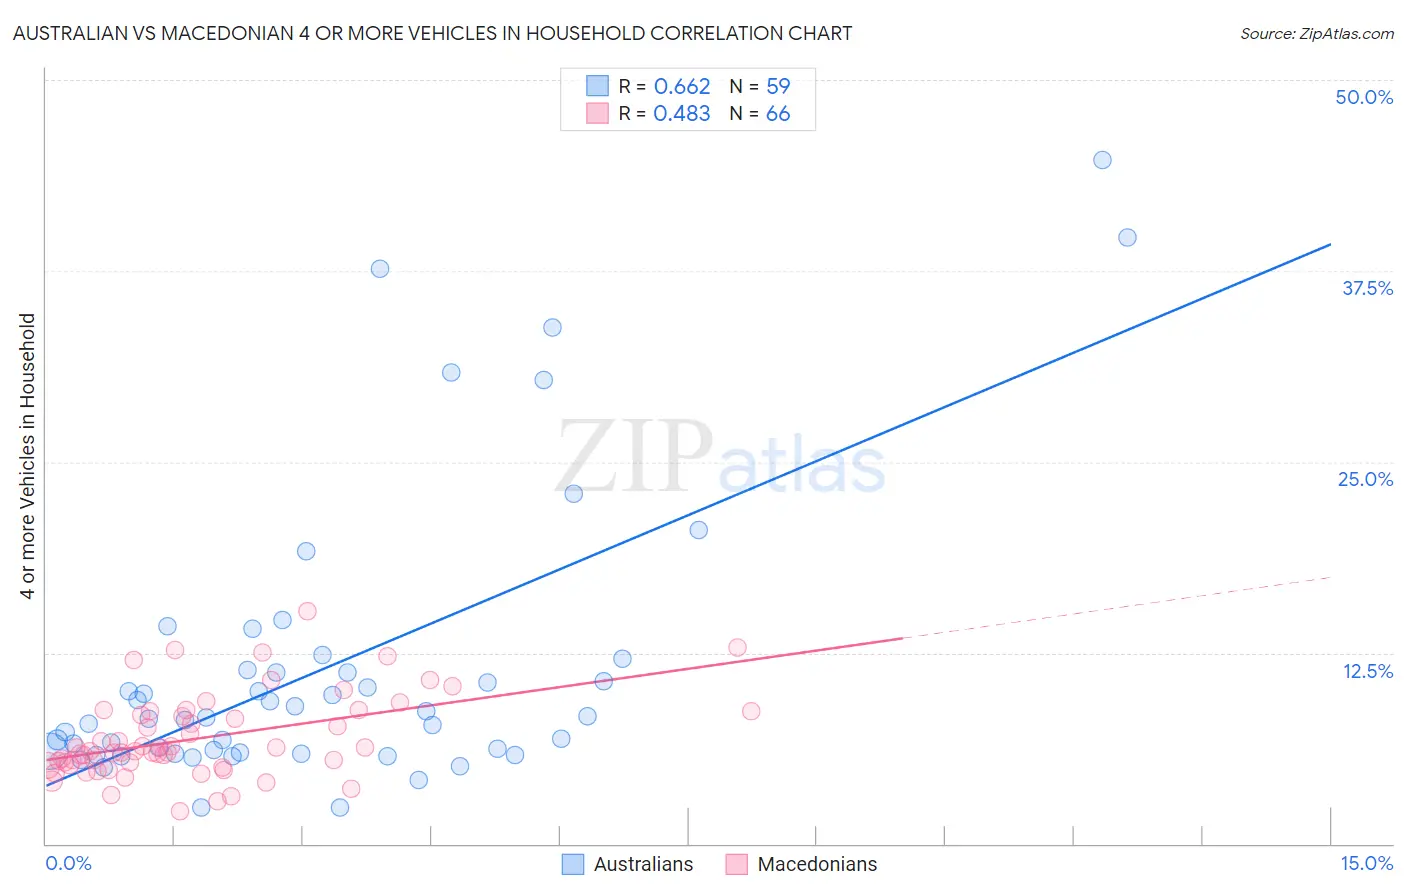
Australian vs Macedonian 4 or more Vehicles in Household Correlation Chart
The statistical analysis conducted on geographies consisting of 223,029,698 people shows a significant positive correlation between the proportion of Australians and percentage of households with 4 or more vehicles available in the United States with a correlation coefficient (R) of 0.662 and weighted average of 6.6%. Similarly, the statistical analysis conducted on geographies consisting of 131,939,711 people shows a moderate positive correlation between the proportion of Macedonians and percentage of households with 4 or more vehicles available in the United States with a correlation coefficient (R) of 0.483 and weighted average of 5.5%, a difference of 19.1%.
4 or more Vehicles in Household Correlation Summary
| Measurement | Australian | Macedonian |
| Minimum | 2.4% | 2.1% |
| Maximum | 44.7% | 15.3% |
| Range | 42.4% | 13.1% |
| Mean | 11.5% | 6.9% |
| Median | 8.3% | 6.1% |
| Interquartile 25% (IQ1) | 6.0% | 5.2% |
| Interquartile 75% (IQ3) | 11.4% | 8.7% |
| Interquartile Range (IQR) | 5.4% | 3.5% |
| Standard Deviation (Sample) | 9.4% | 2.7% |
| Standard Deviation (Population) | 9.3% | 2.7% |
Similar Demographics by 4 or more Vehicles in Household
Demographics Similar to Australians by 4 or more Vehicles in Household
In terms of 4 or more vehicles in household, the demographic groups most similar to Australians are Slavic (6.6%, a difference of 0.13%), Immigrants from Iraq (6.5%, a difference of 0.20%), Jordanian (6.6%, a difference of 0.21%), Immigrants from Canada (6.5%, a difference of 0.33%), and Immigrants from North America (6.5%, a difference of 0.35%).
| Demographics | Rating | Rank | 4 or more Vehicles in Household |
| Ottawa | 86.9 /100 | #134 | Excellent 6.6% |
| Tohono O'odham | 86.7 /100 | #135 | Excellent 6.6% |
| Luxembourgers | 86.4 /100 | #136 | Excellent 6.6% |
| French Canadians | 85.4 /100 | #137 | Excellent 6.6% |
| Italians | 84.5 /100 | #138 | Excellent 6.6% |
| Jordanians | 82.1 /100 | #139 | Excellent 6.6% |
| Slavs | 81.6 /100 | #140 | Excellent 6.6% |
| Australians | 80.8 /100 | #141 | Excellent 6.6% |
| Immigrants | Iraq | 79.4 /100 | #142 | Good 6.5% |
| Immigrants | Canada | 78.6 /100 | #143 | Good 6.5% |
| Immigrants | North America | 78.5 /100 | #144 | Good 6.5% |
| Croatians | 77.8 /100 | #145 | Good 6.5% |
| Immigrants | Costa Rica | 74.4 /100 | #146 | Good 6.5% |
| Immigrants | Iran | 73.9 /100 | #147 | Good 6.5% |
| Immigrants | Jordan | 73.7 /100 | #148 | Good 6.5% |
Demographics Similar to Macedonians by 4 or more Vehicles in Household
In terms of 4 or more vehicles in household, the demographic groups most similar to Macedonians are Immigrants from Kazakhstan (5.5%, a difference of 0.030%), Black/African American (5.5%, a difference of 0.12%), Immigrants from Sudan (5.5%, a difference of 0.23%), Cambodian (5.5%, a difference of 0.24%), and Immigrants from Latvia (5.5%, a difference of 0.25%).
| Demographics | Rating | Rank | 4 or more Vehicles in Household |
| Immigrants | Nepal | 0.9 /100 | #266 | Tragic 5.6% |
| Immigrants | Ukraine | 0.9 /100 | #267 | Tragic 5.6% |
| Colombians | 0.7 /100 | #268 | Tragic 5.5% |
| Carpatho Rusyns | 0.7 /100 | #269 | Tragic 5.5% |
| Okinawans | 0.6 /100 | #270 | Tragic 5.5% |
| Immigrants | Sudan | 0.6 /100 | #271 | Tragic 5.5% |
| Immigrants | Kazakhstan | 0.6 /100 | #272 | Tragic 5.5% |
| Macedonians | 0.6 /100 | #273 | Tragic 5.5% |
| Blacks/African Americans | 0.6 /100 | #274 | Tragic 5.5% |
| Cambodians | 0.5 /100 | #275 | Tragic 5.5% |
| Immigrants | Latvia | 0.5 /100 | #276 | Tragic 5.5% |
| Immigrants | Bulgaria | 0.5 /100 | #277 | Tragic 5.5% |
| Immigrants | Eastern Europe | 0.4 /100 | #278 | Tragic 5.4% |
| Immigrants | Uruguay | 0.3 /100 | #279 | Tragic 5.4% |
| Alsatians | 0.3 /100 | #280 | Tragic 5.4% |