Australian vs Cheyenne 4 or more Vehicles in Household
COMPARE
Australian
Cheyenne
4 or more Vehicles in Household
4 or more Vehicles in Household Comparison
Australians
Cheyenne
6.6%
4 OR MORE VEHICLES IN HOUSEHOLD
80.8/ 100
METRIC RATING
141st/ 347
METRIC RANK
8.3%
4 OR MORE VEHICLES IN HOUSEHOLD
100.0/ 100
METRIC RATING
28th/ 347
METRIC RANK
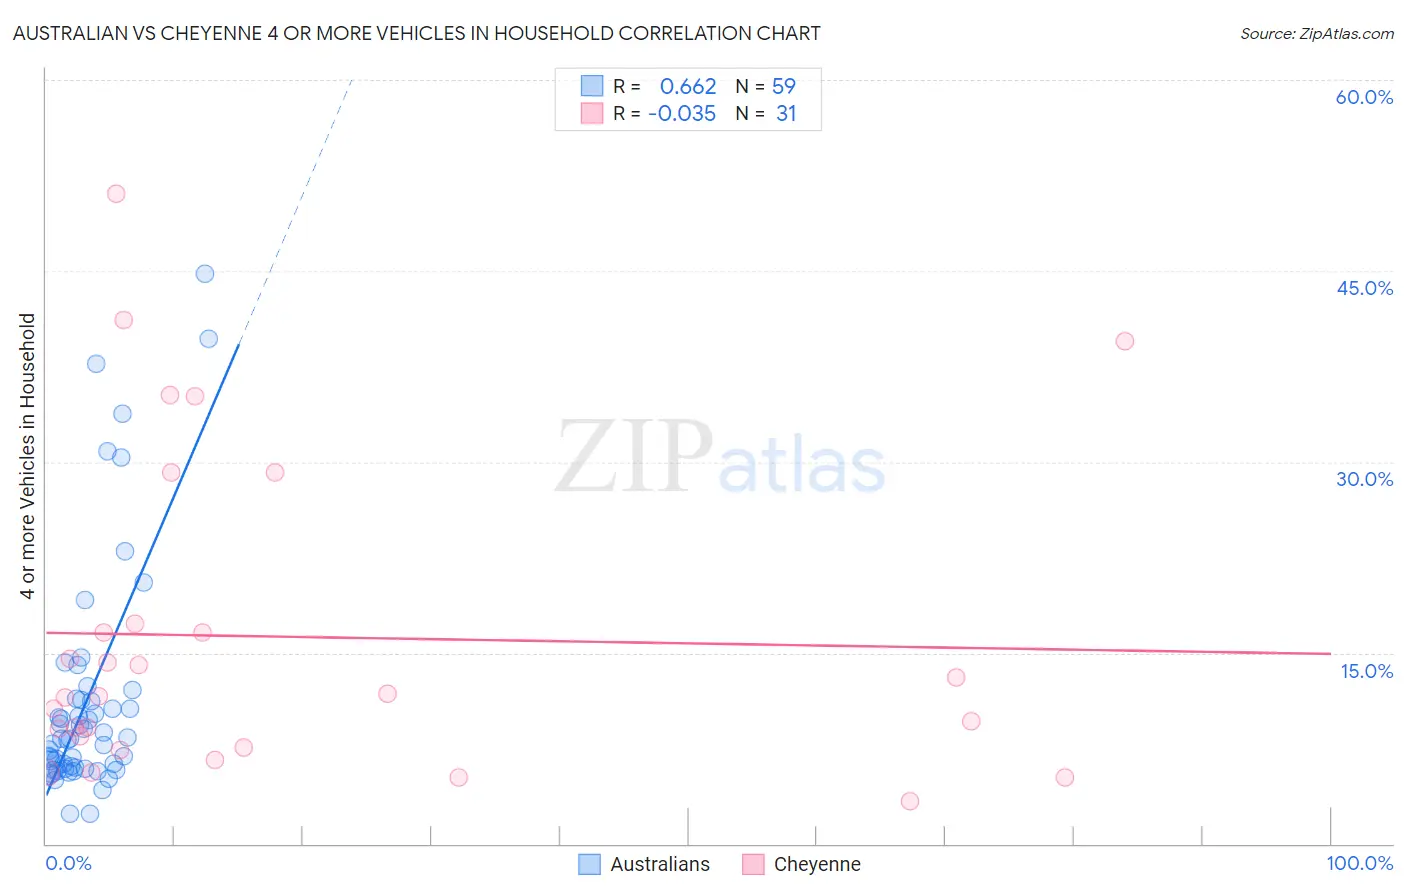
Australian vs Cheyenne 4 or more Vehicles in Household Correlation Chart
The statistical analysis conducted on geographies consisting of 223,029,698 people shows a significant positive correlation between the proportion of Australians and percentage of households with 4 or more vehicles available in the United States with a correlation coefficient (R) of 0.662 and weighted average of 6.6%. Similarly, the statistical analysis conducted on geographies consisting of 80,661,568 people shows no correlation between the proportion of Cheyenne and percentage of households with 4 or more vehicles available in the United States with a correlation coefficient (R) of -0.035 and weighted average of 8.3%, a difference of 26.3%.
4 or more Vehicles in Household Correlation Summary
| Measurement | Australian | Cheyenne |
| Minimum | 2.4% | 3.3% |
| Maximum | 44.7% | 51.1% |
| Range | 42.4% | 47.8% |
| Mean | 11.5% | 16.3% |
| Median | 8.3% | 11.5% |
| Interquartile 25% (IQ1) | 6.0% | 7.5% |
| Interquartile 75% (IQ3) | 11.4% | 17.3% |
| Interquartile Range (IQR) | 5.4% | 9.8% |
| Standard Deviation (Sample) | 9.4% | 12.5% |
| Standard Deviation (Population) | 9.3% | 12.3% |
Similar Demographics by 4 or more Vehicles in Household
Demographics Similar to Australians by 4 or more Vehicles in Household
In terms of 4 or more vehicles in household, the demographic groups most similar to Australians are Slavic (6.6%, a difference of 0.13%), Immigrants from Iraq (6.5%, a difference of 0.20%), Jordanian (6.6%, a difference of 0.21%), Immigrants from Canada (6.5%, a difference of 0.33%), and Immigrants from North America (6.5%, a difference of 0.35%).
| Demographics | Rating | Rank | 4 or more Vehicles in Household |
| Ottawa | 86.9 /100 | #134 | Excellent 6.6% |
| Tohono O'odham | 86.7 /100 | #135 | Excellent 6.6% |
| Luxembourgers | 86.4 /100 | #136 | Excellent 6.6% |
| French Canadians | 85.4 /100 | #137 | Excellent 6.6% |
| Italians | 84.5 /100 | #138 | Excellent 6.6% |
| Jordanians | 82.1 /100 | #139 | Excellent 6.6% |
| Slavs | 81.6 /100 | #140 | Excellent 6.6% |
| Australians | 80.8 /100 | #141 | Excellent 6.6% |
| Immigrants | Iraq | 79.4 /100 | #142 | Good 6.5% |
| Immigrants | Canada | 78.6 /100 | #143 | Good 6.5% |
| Immigrants | North America | 78.5 /100 | #144 | Good 6.5% |
| Croatians | 77.8 /100 | #145 | Good 6.5% |
| Immigrants | Costa Rica | 74.4 /100 | #146 | Good 6.5% |
| Immigrants | Iran | 73.9 /100 | #147 | Good 6.5% |
| Immigrants | Jordan | 73.7 /100 | #148 | Good 6.5% |
Demographics Similar to Cheyenne by 4 or more Vehicles in Household
In terms of 4 or more vehicles in household, the demographic groups most similar to Cheyenne are Immigrants from South Eastern Asia (8.2%, a difference of 0.66%), Navajo (8.2%, a difference of 0.69%), Native/Alaskan (8.2%, a difference of 1.1%), Sri Lankan (8.4%, a difference of 1.4%), and Mexican American Indian (8.4%, a difference of 1.5%).
| Demographics | Rating | Rank | 4 or more Vehicles in Household |
| Danes | 100.0 /100 | #21 | Exceptional 8.6% |
| Immigrants | Vietnam | 100.0 /100 | #22 | Exceptional 8.6% |
| Immigrants | Philippines | 100.0 /100 | #23 | Exceptional 8.5% |
| Immigrants | Central America | 100.0 /100 | #24 | Exceptional 8.5% |
| Basques | 100.0 /100 | #25 | Exceptional 8.4% |
| Mexican American Indians | 100.0 /100 | #26 | Exceptional 8.4% |
| Sri Lankans | 100.0 /100 | #27 | Exceptional 8.4% |
| Cheyenne | 100.0 /100 | #28 | Exceptional 8.3% |
| Immigrants | South Eastern Asia | 100.0 /100 | #29 | Exceptional 8.2% |
| Navajo | 100.0 /100 | #30 | Exceptional 8.2% |
| Natives/Alaskans | 100.0 /100 | #31 | Exceptional 8.2% |
| Marshallese | 100.0 /100 | #32 | Exceptional 8.1% |
| Yaqui | 100.0 /100 | #33 | Exceptional 8.1% |
| Alaskan Athabascans | 100.0 /100 | #34 | Exceptional 8.1% |
| Guamanians/Chamorros | 100.0 /100 | #35 | Exceptional 8.1% |