Assyrian/Chaldean/Syriac vs Israeli No Vehicles in Household
COMPARE
Assyrian/Chaldean/Syriac
Israeli
No Vehicles in Household
No Vehicles in Household Comparison
Assyrians/Chaldeans/Syriacs
Israelis
7.0%
NO VEHICLES IN HOUSEHOLD
100.0/ 100
METRIC RATING
12th/ 347
METRIC RANK
12.4%
NO VEHICLES IN HOUSEHOLD
0.3/ 100
METRIC RATING
266th/ 347
METRIC RANK
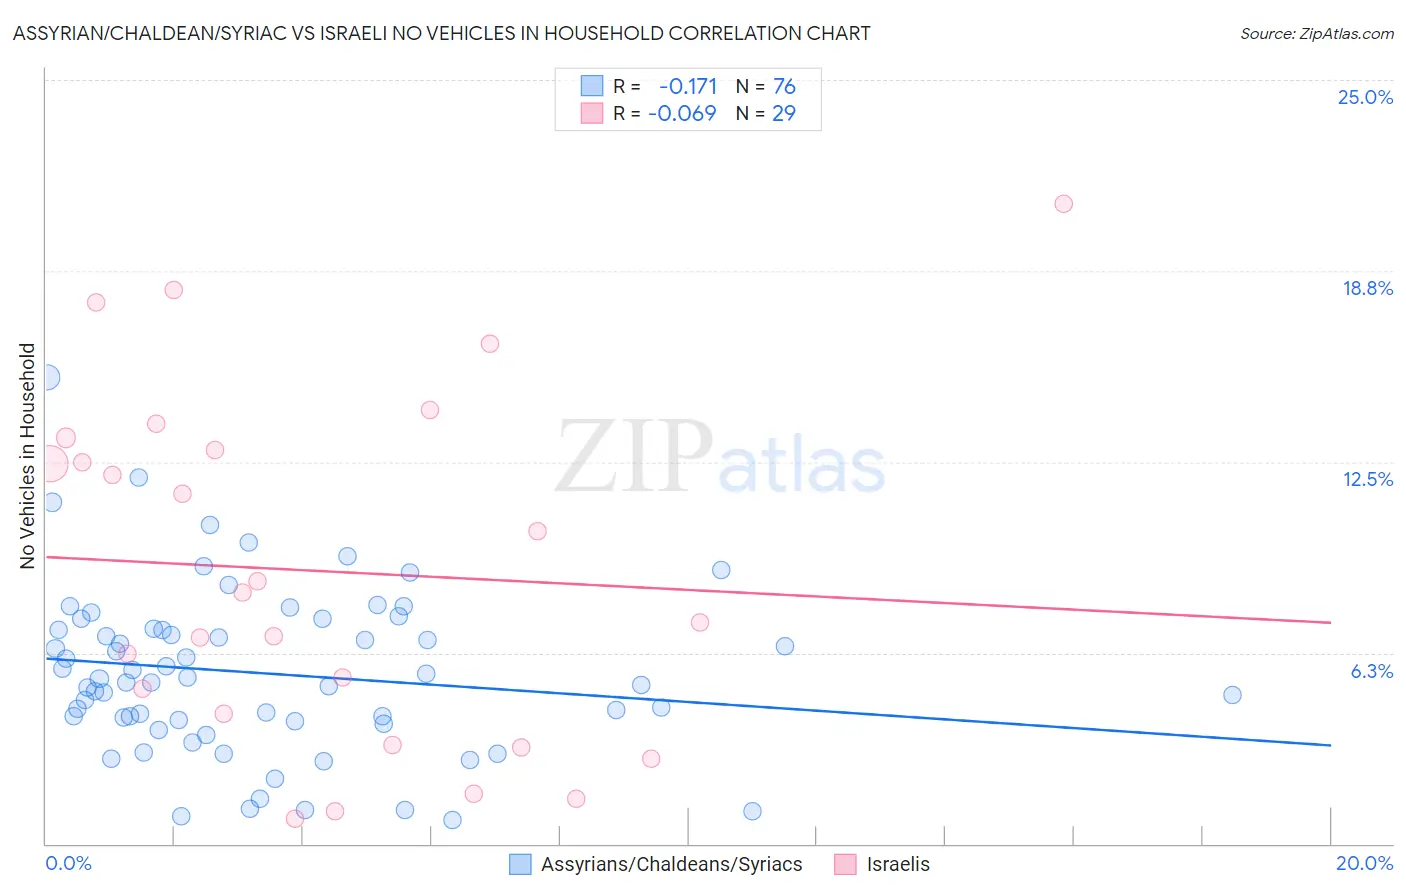
Assyrian/Chaldean/Syriac vs Israeli No Vehicles in Household Correlation Chart
The statistical analysis conducted on geographies consisting of 110,265,900 people shows a poor negative correlation between the proportion of Assyrians/Chaldeans/Syriacs and percentage of households with no vehicle available in the United States with a correlation coefficient (R) of -0.171 and weighted average of 7.0%. Similarly, the statistical analysis conducted on geographies consisting of 210,769,657 people shows a slight negative correlation between the proportion of Israelis and percentage of households with no vehicle available in the United States with a correlation coefficient (R) of -0.069 and weighted average of 12.4%, a difference of 78.2%.
No Vehicles in Household Correlation Summary
| Measurement | Assyrian/Chaldean/Syriac | Israeli |
| Minimum | 0.78% | 0.80% |
| Maximum | 15.3% | 20.9% |
| Range | 14.5% | 20.1% |
| Mean | 5.6% | 8.9% |
| Median | 5.3% | 8.2% |
| Interquartile 25% (IQ1) | 4.0% | 3.8% |
| Interquartile 75% (IQ3) | 7.0% | 13.1% |
| Interquartile Range (IQR) | 3.0% | 9.3% |
| Standard Deviation (Sample) | 2.7% | 5.7% |
| Standard Deviation (Population) | 2.7% | 5.6% |
Similar Demographics by No Vehicles in Household
Demographics Similar to Assyrians/Chaldeans/Syriacs by No Vehicles in Household
In terms of no vehicles in household, the demographic groups most similar to Assyrians/Chaldeans/Syriacs are Scandinavian (7.0%, a difference of 0.50%), Mexican (7.0%, a difference of 0.67%), White/Caucasian (7.0%, a difference of 0.80%), Czech (6.9%, a difference of 1.4%), and European (7.1%, a difference of 2.0%).
| Demographics | Rating | Rank | No Vehicles in Household |
| Yakama | 100.0 /100 | #5 | Exceptional 6.6% |
| Germans | 100.0 /100 | #6 | Exceptional 6.7% |
| Scottish | 100.0 /100 | #7 | Exceptional 6.8% |
| Swedes | 100.0 /100 | #8 | Exceptional 6.8% |
| Scotch-Irish | 100.0 /100 | #9 | Exceptional 6.8% |
| Dutch | 100.0 /100 | #10 | Exceptional 6.8% |
| Czechs | 100.0 /100 | #11 | Exceptional 6.9% |
| Assyrians/Chaldeans/Syriacs | 100.0 /100 | #12 | Exceptional 7.0% |
| Scandinavians | 100.0 /100 | #13 | Exceptional 7.0% |
| Mexicans | 100.0 /100 | #14 | Exceptional 7.0% |
| Whites/Caucasians | 100.0 /100 | #15 | Exceptional 7.0% |
| Europeans | 100.0 /100 | #16 | Exceptional 7.1% |
| Welsh | 100.0 /100 | #17 | Exceptional 7.2% |
| Tongans | 100.0 /100 | #18 | Exceptional 7.2% |
| Arapaho | 100.0 /100 | #19 | Exceptional 7.4% |
Demographics Similar to Israelis by No Vehicles in Household
In terms of no vehicles in household, the demographic groups most similar to Israelis are Immigrants from Europe (12.5%, a difference of 0.58%), Immigrants from Africa (12.5%, a difference of 0.63%), Panamanian (12.5%, a difference of 0.76%), African (12.3%, a difference of 0.96%), and Immigrants from Switzerland (12.3%, a difference of 1.2%).
| Demographics | Rating | Rank | No Vehicles in Household |
| Immigrants | Latvia | 0.8 /100 | #259 | Tragic 12.1% |
| Macedonians | 0.7 /100 | #260 | Tragic 12.2% |
| Sub-Saharan Africans | 0.6 /100 | #261 | Tragic 12.2% |
| Immigrants | Liberia | 0.6 /100 | #262 | Tragic 12.2% |
| Immigrants | Egypt | 0.6 /100 | #263 | Tragic 12.2% |
| Immigrants | Switzerland | 0.5 /100 | #264 | Tragic 12.3% |
| Africans | 0.4 /100 | #265 | Tragic 12.3% |
| Israelis | 0.3 /100 | #266 | Tragic 12.4% |
| Immigrants | Europe | 0.3 /100 | #267 | Tragic 12.5% |
| Immigrants | Africa | 0.2 /100 | #268 | Tragic 12.5% |
| Panamanians | 0.2 /100 | #269 | Tragic 12.5% |
| Immigrants | Northern Africa | 0.2 /100 | #270 | Tragic 12.6% |
| Immigrants | Morocco | 0.2 /100 | #271 | Tragic 12.6% |
| Bermudans | 0.1 /100 | #272 | Tragic 12.8% |
| Immigrants | France | 0.1 /100 | #273 | Tragic 12.9% |