Assyrian/Chaldean/Syriac vs Luxembourger No Vehicles in Household
COMPARE
Assyrian/Chaldean/Syriac
Luxembourger
No Vehicles in Household
No Vehicles in Household Comparison
Assyrians/Chaldeans/Syriacs
Luxembourgers
7.0%
NO VEHICLES IN HOUSEHOLD
100.0/ 100
METRIC RATING
12th/ 347
METRIC RANK
5.4%
NO VEHICLES IN HOUSEHOLD
100.0/ 100
METRIC RATING
1st/ 347
METRIC RANK
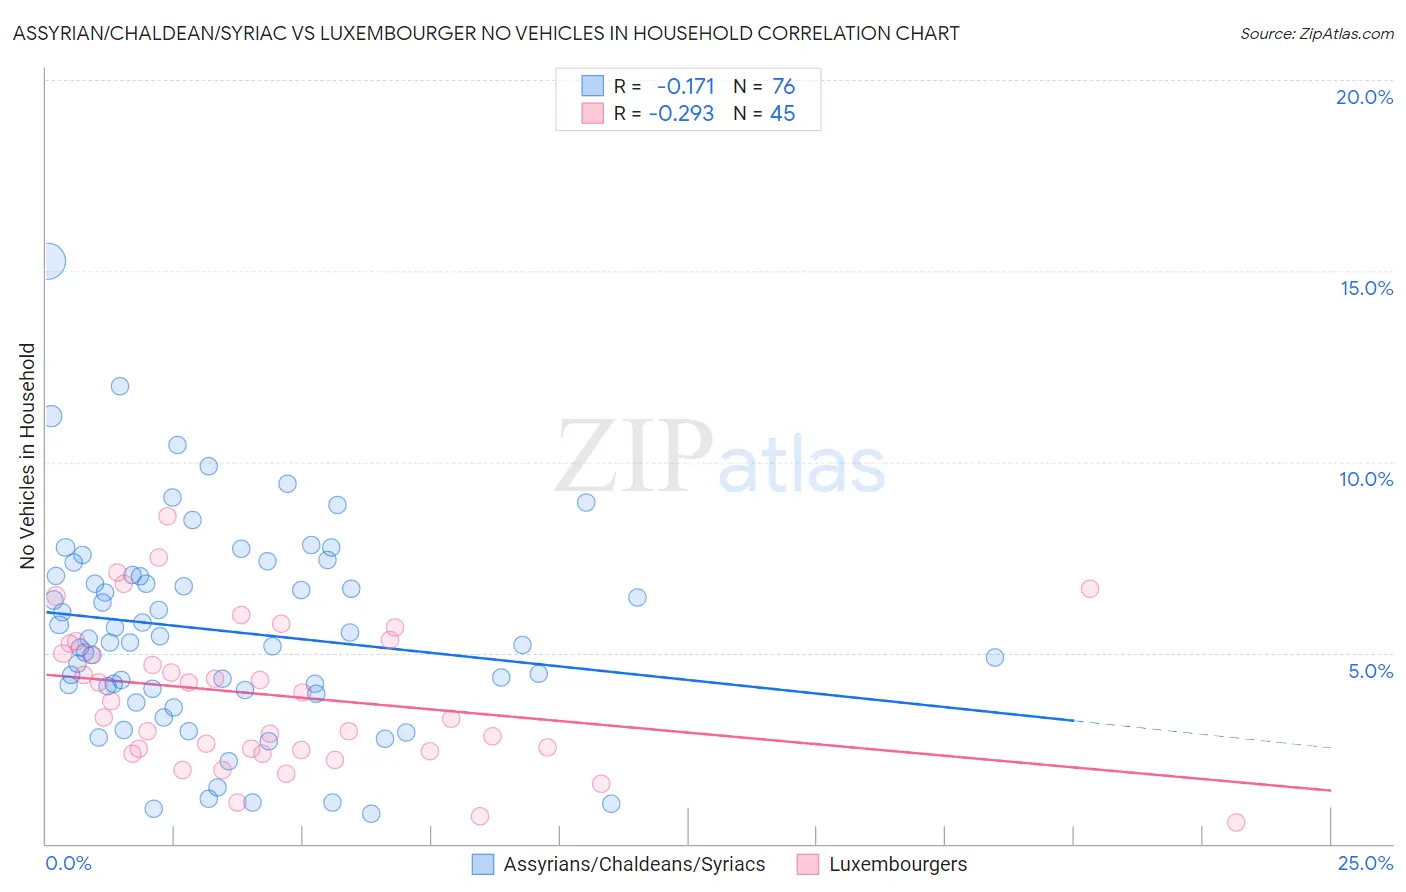
Assyrian/Chaldean/Syriac vs Luxembourger No Vehicles in Household Correlation Chart
The statistical analysis conducted on geographies consisting of 110,265,900 people shows a poor negative correlation between the proportion of Assyrians/Chaldeans/Syriacs and percentage of households with no vehicle available in the United States with a correlation coefficient (R) of -0.171 and weighted average of 7.0%. Similarly, the statistical analysis conducted on geographies consisting of 11,375,262 people shows a weak negative correlation between the proportion of Luxembourgers and percentage of households with no vehicle available in the United States with a correlation coefficient (R) of -0.293 and weighted average of 5.4%, a difference of 30.3%.
No Vehicles in Household Correlation Summary
| Measurement | Assyrian/Chaldean/Syriac | Luxembourger |
| Minimum | 0.78% | 0.55% |
| Maximum | 15.3% | 8.6% |
| Range | 14.5% | 8.0% |
| Mean | 5.6% | 3.9% |
| Median | 5.3% | 3.7% |
| Interquartile 25% (IQ1) | 4.0% | 2.4% |
| Interquartile 75% (IQ3) | 7.0% | 5.3% |
| Interquartile Range (IQR) | 3.0% | 2.9% |
| Standard Deviation (Sample) | 2.7% | 1.9% |
| Standard Deviation (Population) | 2.7% | 1.9% |
Demographics Similar to Assyrians/Chaldeans/Syriacs and Luxembourgers by No Vehicles in Household
In terms of no vehicles in household, the demographic groups most similar to Assyrians/Chaldeans/Syriacs are Scandinavian (7.0%, a difference of 0.50%), Mexican (7.0%, a difference of 0.67%), White/Caucasian (7.0%, a difference of 0.80%), Czech (6.9%, a difference of 1.4%), and European (7.1%, a difference of 2.0%). Similarly, the demographic groups most similar to Luxembourgers are Norwegian (6.4%, a difference of 20.2%), English (6.5%, a difference of 21.5%), Danish (6.6%, a difference of 23.0%), Yakama (6.6%, a difference of 23.4%), and German (6.7%, a difference of 24.6%).
| Demographics | Rating | Rank | No Vehicles in Household |
| Luxembourgers | 100.0 /100 | #1 | Exceptional 5.4% |
| Norwegians | 100.0 /100 | #2 | Exceptional 6.4% |
| English | 100.0 /100 | #3 | Exceptional 6.5% |
| Danes | 100.0 /100 | #4 | Exceptional 6.6% |
| Yakama | 100.0 /100 | #5 | Exceptional 6.6% |
| Germans | 100.0 /100 | #6 | Exceptional 6.7% |
| Scottish | 100.0 /100 | #7 | Exceptional 6.8% |
| Swedes | 100.0 /100 | #8 | Exceptional 6.8% |
| Scotch-Irish | 100.0 /100 | #9 | Exceptional 6.8% |
| Dutch | 100.0 /100 | #10 | Exceptional 6.8% |
| Czechs | 100.0 /100 | #11 | Exceptional 6.9% |
| Assyrians/Chaldeans/Syriacs | 100.0 /100 | #12 | Exceptional 7.0% |
| Scandinavians | 100.0 /100 | #13 | Exceptional 7.0% |
| Mexicans | 100.0 /100 | #14 | Exceptional 7.0% |
| Whites/Caucasians | 100.0 /100 | #15 | Exceptional 7.0% |
| Europeans | 100.0 /100 | #16 | Exceptional 7.1% |
| Welsh | 100.0 /100 | #17 | Exceptional 7.2% |
| Tongans | 100.0 /100 | #18 | Exceptional 7.2% |
| Arapaho | 100.0 /100 | #19 | Exceptional 7.4% |
| Ottawa | 100.0 /100 | #20 | Exceptional 7.4% |