Assyrian/Chaldean/Syriac vs Native/Alaskan No Vehicles in Household
COMPARE
Assyrian/Chaldean/Syriac
Native/Alaskan
No Vehicles in Household
No Vehicles in Household Comparison
Assyrians/Chaldeans/Syriacs
Natives/Alaskans
7.0%
NO VEHICLES IN HOUSEHOLD
100.0/ 100
METRIC RATING
12th/ 347
METRIC RANK
10.5%
NO VEHICLES IN HOUSEHOLD
43.7/ 100
METRIC RATING
183rd/ 347
METRIC RANK
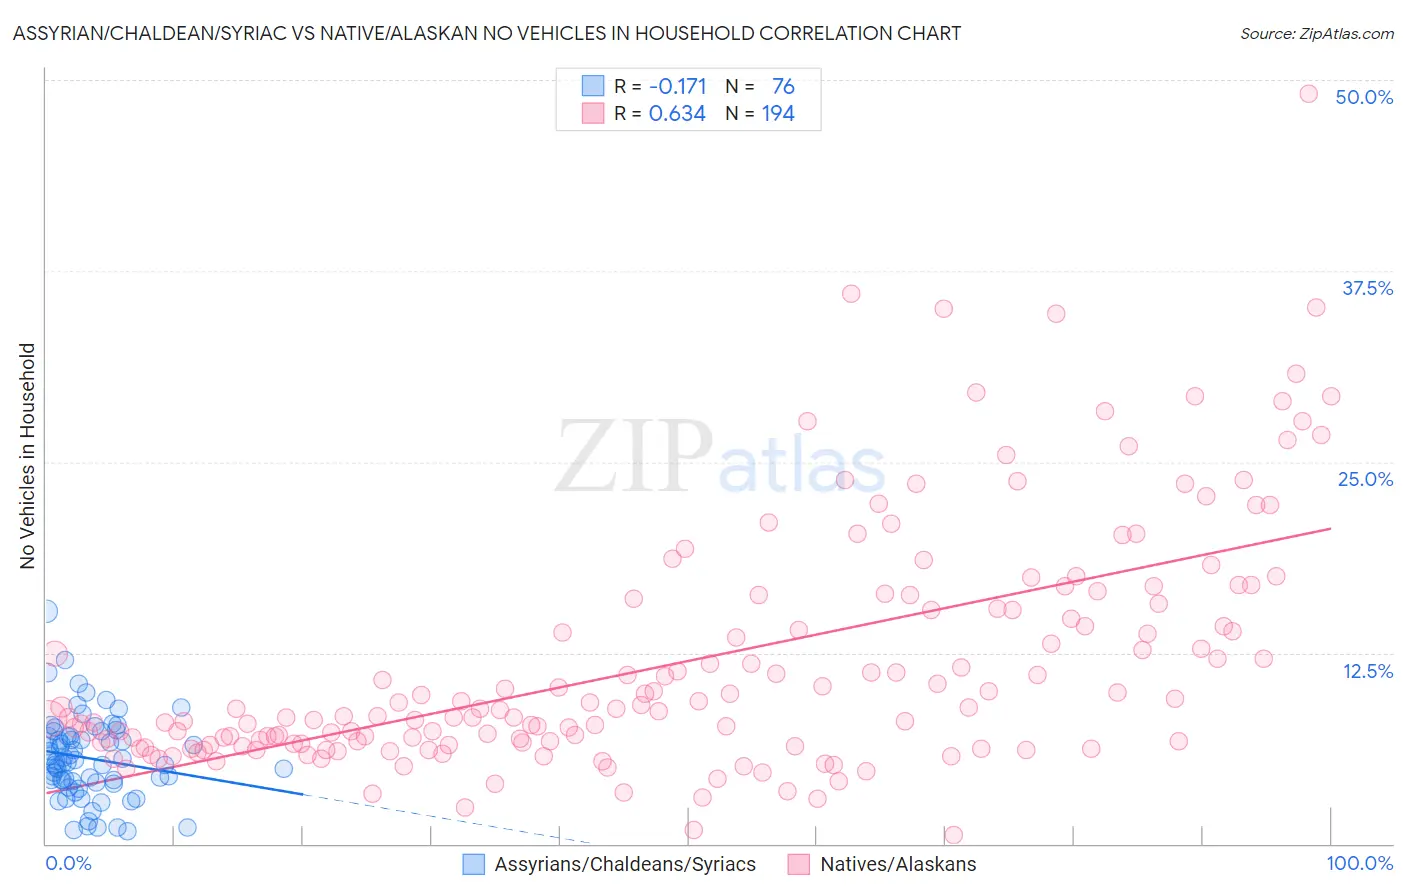
Assyrian/Chaldean/Syriac vs Native/Alaskan No Vehicles in Household Correlation Chart
The statistical analysis conducted on geographies consisting of 110,265,900 people shows a poor negative correlation between the proportion of Assyrians/Chaldeans/Syriacs and percentage of households with no vehicle available in the United States with a correlation coefficient (R) of -0.171 and weighted average of 7.0%. Similarly, the statistical analysis conducted on geographies consisting of 510,438,252 people shows a significant positive correlation between the proportion of Natives/Alaskans and percentage of households with no vehicle available in the United States with a correlation coefficient (R) of 0.634 and weighted average of 10.5%, a difference of 50.4%.
No Vehicles in Household Correlation Summary
| Measurement | Assyrian/Chaldean/Syriac | Native/Alaskan |
| Minimum | 0.78% | 0.55% |
| Maximum | 15.3% | 49.1% |
| Range | 14.5% | 48.5% |
| Mean | 5.6% | 11.9% |
| Median | 5.3% | 8.8% |
| Interquartile 25% (IQ1) | 4.0% | 6.6% |
| Interquartile 75% (IQ3) | 7.0% | 15.3% |
| Interquartile Range (IQR) | 3.0% | 8.8% |
| Standard Deviation (Sample) | 2.7% | 7.9% |
| Standard Deviation (Population) | 2.7% | 7.9% |
Similar Demographics by No Vehicles in Household
Demographics Similar to Assyrians/Chaldeans/Syriacs by No Vehicles in Household
In terms of no vehicles in household, the demographic groups most similar to Assyrians/Chaldeans/Syriacs are Scandinavian (7.0%, a difference of 0.50%), Mexican (7.0%, a difference of 0.67%), White/Caucasian (7.0%, a difference of 0.80%), Czech (6.9%, a difference of 1.4%), and European (7.1%, a difference of 2.0%).
| Demographics | Rating | Rank | No Vehicles in Household |
| Yakama | 100.0 /100 | #5 | Exceptional 6.6% |
| Germans | 100.0 /100 | #6 | Exceptional 6.7% |
| Scottish | 100.0 /100 | #7 | Exceptional 6.8% |
| Swedes | 100.0 /100 | #8 | Exceptional 6.8% |
| Scotch-Irish | 100.0 /100 | #9 | Exceptional 6.8% |
| Dutch | 100.0 /100 | #10 | Exceptional 6.8% |
| Czechs | 100.0 /100 | #11 | Exceptional 6.9% |
| Assyrians/Chaldeans/Syriacs | 100.0 /100 | #12 | Exceptional 7.0% |
| Scandinavians | 100.0 /100 | #13 | Exceptional 7.0% |
| Mexicans | 100.0 /100 | #14 | Exceptional 7.0% |
| Whites/Caucasians | 100.0 /100 | #15 | Exceptional 7.0% |
| Europeans | 100.0 /100 | #16 | Exceptional 7.1% |
| Welsh | 100.0 /100 | #17 | Exceptional 7.2% |
| Tongans | 100.0 /100 | #18 | Exceptional 7.2% |
| Arapaho | 100.0 /100 | #19 | Exceptional 7.4% |
Demographics Similar to Natives/Alaskans by No Vehicles in Household
In terms of no vehicles in household, the demographic groups most similar to Natives/Alaskans are Immigrants from Bulgaria (10.5%, a difference of 0.020%), Immigrants from Colombia (10.5%, a difference of 0.060%), Immigrants from Nepal (10.5%, a difference of 0.17%), Arab (10.5%, a difference of 0.22%), and South American (10.5%, a difference of 0.24%).
| Demographics | Rating | Rank | No Vehicles in Household |
| French American Indians | 49.1 /100 | #176 | Average 10.4% |
| Immigrants | El Salvador | 49.1 /100 | #177 | Average 10.4% |
| Immigrants | Ethiopia | 48.0 /100 | #178 | Average 10.4% |
| Ethiopians | 45.8 /100 | #179 | Average 10.5% |
| Arabs | 45.3 /100 | #180 | Average 10.5% |
| Immigrants | Colombia | 44.1 /100 | #181 | Average 10.5% |
| Immigrants | Bulgaria | 43.8 /100 | #182 | Average 10.5% |
| Natives/Alaskans | 43.7 /100 | #183 | Average 10.5% |
| Immigrants | Nepal | 42.4 /100 | #184 | Average 10.5% |
| South Americans | 41.9 /100 | #185 | Average 10.5% |
| German Russians | 40.6 /100 | #186 | Average 10.5% |
| Immigrants | Poland | 38.4 /100 | #187 | Fair 10.6% |
| Immigrants | Armenia | 37.5 /100 | #188 | Fair 10.6% |
| Immigrants | Eritrea | 36.3 /100 | #189 | Fair 10.6% |
| Immigrants | North Macedonia | 34.6 /100 | #190 | Fair 10.6% |