Assyrian/Chaldean/Syriac vs Luxembourger 7th Grade
COMPARE
Assyrian/Chaldean/Syriac
Luxembourger
7th Grade
7th Grade Comparison
Assyrians/Chaldeans/Syriacs
Luxembourgers
95.8%
7TH GRADE
20.5/ 100
METRIC RATING
204th/ 347
METRIC RANK
97.2%
7TH GRADE
100.0/ 100
METRIC RATING
40th/ 347
METRIC RANK
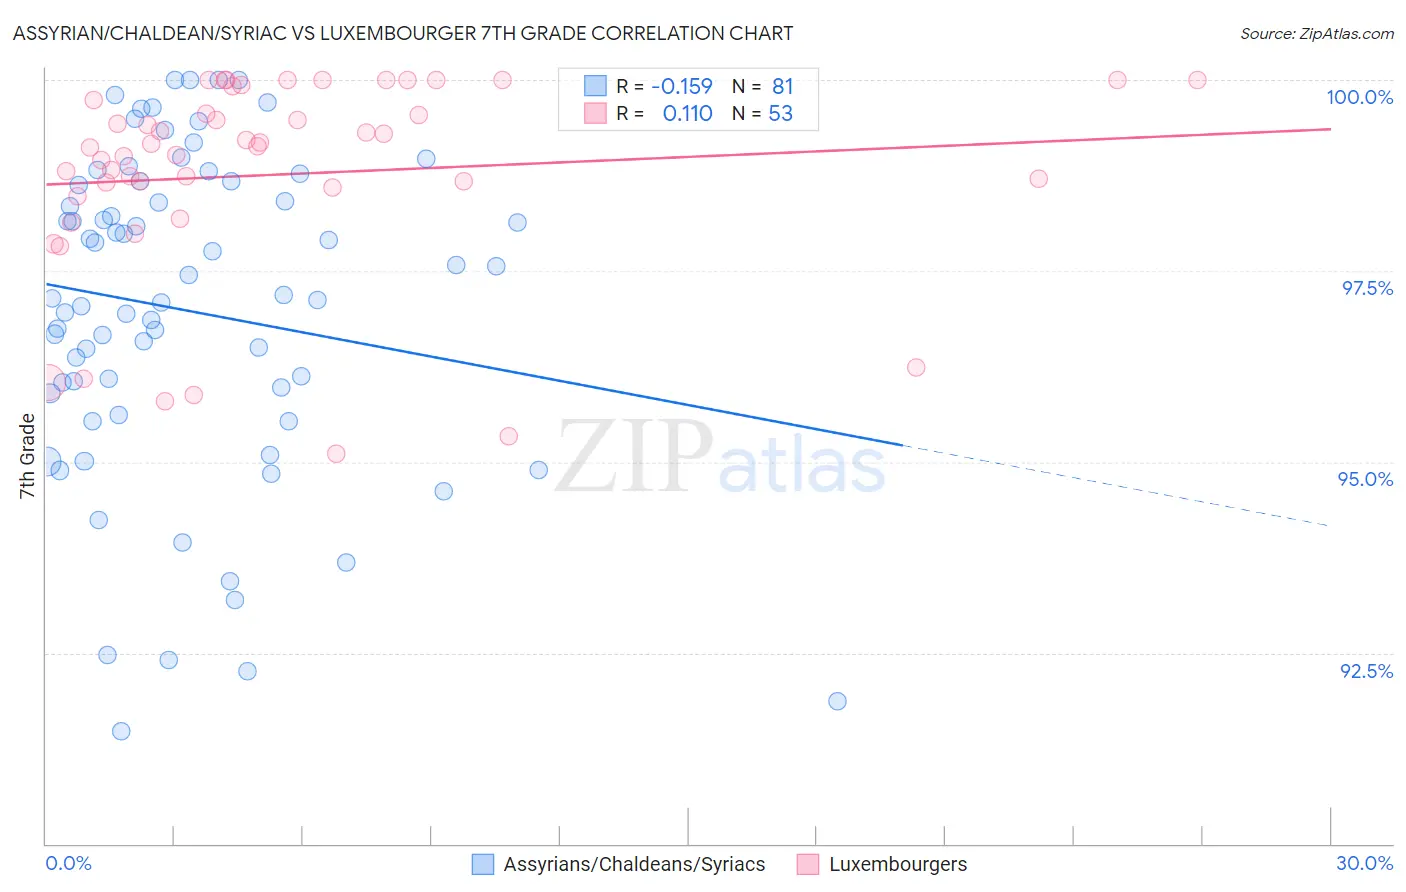
Assyrian/Chaldean/Syriac vs Luxembourger 7th Grade Correlation Chart
The statistical analysis conducted on geographies consisting of 110,318,304 people shows a poor negative correlation between the proportion of Assyrians/Chaldeans/Syriacs and percentage of population with at least 7th grade education in the United States with a correlation coefficient (R) of -0.159 and weighted average of 95.8%. Similarly, the statistical analysis conducted on geographies consisting of 144,676,190 people shows a poor positive correlation between the proportion of Luxembourgers and percentage of population with at least 7th grade education in the United States with a correlation coefficient (R) of 0.110 and weighted average of 97.2%, a difference of 1.4%.
7th Grade Correlation Summary
| Measurement | Assyrian/Chaldean/Syriac | Luxembourger |
| Minimum | 91.5% | 95.1% |
| Maximum | 100.0% | 100.0% |
| Range | 8.5% | 4.9% |
| Mean | 97.0% | 98.8% |
| Median | 97.1% | 99.1% |
| Interquartile 25% (IQ1) | 95.8% | 98.5% |
| Interquartile 75% (IQ3) | 98.7% | 99.8% |
| Interquartile Range (IQR) | 2.9% | 1.3% |
| Standard Deviation (Sample) | 2.1% | 1.3% |
| Standard Deviation (Population) | 2.1% | 1.3% |
Similar Demographics by 7th Grade
Demographics Similar to Assyrians/Chaldeans/Syriacs by 7th Grade
In terms of 7th grade, the demographic groups most similar to Assyrians/Chaldeans/Syriacs are Immigrants from Argentina (95.9%, a difference of 0.010%), Immigrants from Northern Africa (95.8%, a difference of 0.010%), Comanche (95.8%, a difference of 0.010%), Argentinean (95.9%, a difference of 0.020%), and Moroccan (95.8%, a difference of 0.020%).
| Demographics | Rating | Rank | 7th Grade |
| Immigrants | Zaire | 26.7 /100 | #197 | Fair 95.9% |
| Paraguayans | 24.8 /100 | #198 | Fair 95.9% |
| Guamanians/Chamorros | 23.5 /100 | #199 | Fair 95.9% |
| Argentineans | 23.2 /100 | #200 | Fair 95.9% |
| Immigrants | Argentina | 21.9 /100 | #201 | Fair 95.9% |
| Immigrants | Northern Africa | 21.4 /100 | #202 | Fair 95.8% |
| Comanche | 21.1 /100 | #203 | Fair 95.8% |
| Assyrians/Chaldeans/Syriacs | 20.5 /100 | #204 | Fair 95.8% |
| Moroccans | 18.9 /100 | #205 | Poor 95.8% |
| Africans | 17.6 /100 | #206 | Poor 95.8% |
| Navajo | 17.0 /100 | #207 | Poor 95.8% |
| Immigrants | Sudan | 17.0 /100 | #208 | Poor 95.8% |
| Dutch West Indians | 16.1 /100 | #209 | Poor 95.8% |
| Hawaiians | 16.0 /100 | #210 | Poor 95.8% |
| Portuguese | 13.6 /100 | #211 | Poor 95.8% |
Demographics Similar to Luxembourgers by 7th Grade
In terms of 7th grade, the demographic groups most similar to Luxembourgers are Latvian (97.2%, a difference of 0.0%), Belgian (97.2%, a difference of 0.010%), British (97.2%, a difference of 0.020%), Eastern European (97.2%, a difference of 0.020%), and Hungarian (97.2%, a difference of 0.030%).
| Demographics | Rating | Rank | 7th Grade |
| Chippewa | 100.0 /100 | #33 | Exceptional 97.3% |
| Alaska Natives | 100.0 /100 | #34 | Exceptional 97.3% |
| Swiss | 100.0 /100 | #35 | Exceptional 97.3% |
| Hungarians | 100.0 /100 | #36 | Exceptional 97.2% |
| British | 100.0 /100 | #37 | Exceptional 97.2% |
| Belgians | 100.0 /100 | #38 | Exceptional 97.2% |
| Latvians | 100.0 /100 | #39 | Exceptional 97.2% |
| Luxembourgers | 100.0 /100 | #40 | Exceptional 97.2% |
| Eastern Europeans | 100.0 /100 | #41 | Exceptional 97.2% |
| Chinese | 99.9 /100 | #42 | Exceptional 97.1% |
| Maltese | 99.9 /100 | #43 | Exceptional 97.1% |
| Northern Europeans | 99.9 /100 | #44 | Exceptional 97.1% |
| Czechoslovakians | 99.9 /100 | #45 | Exceptional 97.1% |
| Aleuts | 99.9 /100 | #46 | Exceptional 97.1% |
| Bulgarians | 99.9 /100 | #47 | Exceptional 97.1% |