Immigrants from Congo vs Luxembourger No Vehicles in Household
COMPARE
Immigrants from Congo
Luxembourger
No Vehicles in Household
No Vehicles in Household Comparison
Immigrants from Congo
Luxembourgers
10.1%
NO VEHICLES IN HOUSEHOLD
73.0/ 100
METRIC RATING
152nd/ 347
METRIC RANK
5.4%
NO VEHICLES IN HOUSEHOLD
100.0/ 100
METRIC RATING
1st/ 347
METRIC RANK
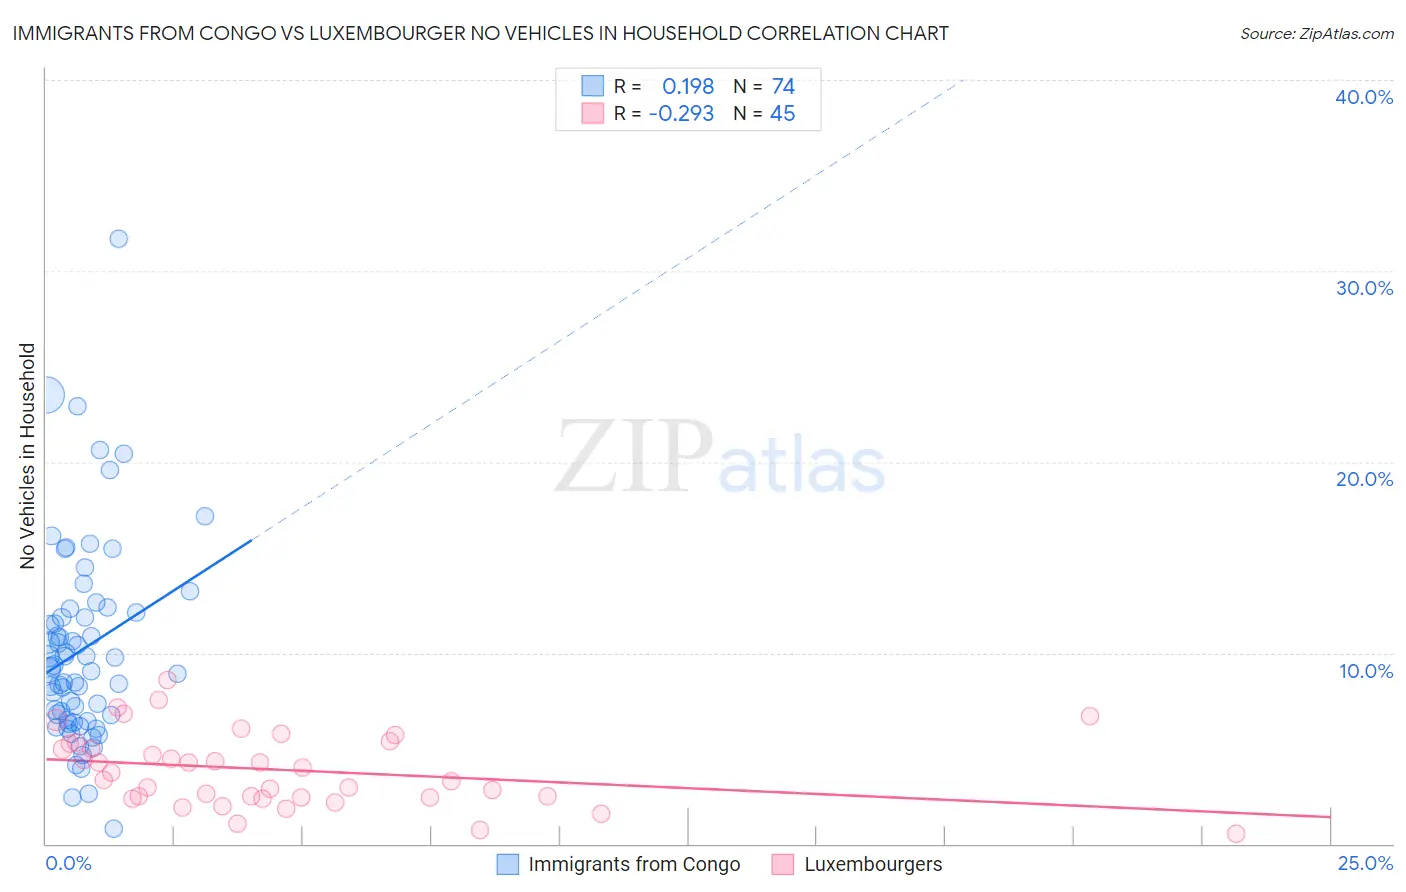
Immigrants from Congo vs Luxembourger No Vehicles in Household Correlation Chart
The statistical analysis conducted on geographies consisting of 92,060,649 people shows a poor positive correlation between the proportion of Immigrants from Congo and percentage of households with no vehicle available in the United States with a correlation coefficient (R) of 0.198 and weighted average of 10.1%. Similarly, the statistical analysis conducted on geographies consisting of 11,375,262 people shows a weak negative correlation between the proportion of Luxembourgers and percentage of households with no vehicle available in the United States with a correlation coefficient (R) of -0.293 and weighted average of 5.4%, a difference of 87.7%.
No Vehicles in Household Correlation Summary
| Measurement | Immigrants from Congo | Luxembourger |
| Minimum | 0.81% | 0.55% |
| Maximum | 31.7% | 8.6% |
| Range | 30.9% | 8.0% |
| Mean | 10.2% | 3.9% |
| Median | 9.2% | 3.7% |
| Interquartile 25% (IQ1) | 6.5% | 2.4% |
| Interquartile 75% (IQ3) | 12.1% | 5.3% |
| Interquartile Range (IQR) | 5.7% | 2.9% |
| Standard Deviation (Sample) | 5.3% | 1.9% |
| Standard Deviation (Population) | 5.2% | 1.9% |
Similar Demographics by No Vehicles in Household
Demographics Similar to Immigrants from Congo by No Vehicles in Household
In terms of no vehicles in household, the demographic groups most similar to Immigrants from Congo are Tlingit-Haida (10.1%, a difference of 0.090%), Sioux (10.1%, a difference of 0.11%), Salvadoran (10.1%, a difference of 0.12%), Immigrants from Eastern Africa (10.0%, a difference of 0.14%), and Colombian (10.0%, a difference of 0.15%).
| Demographics | Rating | Rank | No Vehicles in Household |
| Bahamians | 81.0 /100 | #145 | Excellent 9.9% |
| Hungarians | 80.0 /100 | #146 | Excellent 9.9% |
| Immigrants | Nicaragua | 79.8 /100 | #147 | Good 9.9% |
| Immigrants | Bosnia and Herzegovina | 79.1 /100 | #148 | Good 9.9% |
| Immigrants | Uganda | 76.1 /100 | #149 | Good 10.0% |
| Colombians | 73.9 /100 | #150 | Good 10.0% |
| Immigrants | Eastern Africa | 73.8 /100 | #151 | Good 10.0% |
| Immigrants | Congo | 73.0 /100 | #152 | Good 10.1% |
| Tlingit-Haida | 72.5 /100 | #153 | Good 10.1% |
| Sioux | 72.4 /100 | #154 | Good 10.1% |
| Salvadorans | 72.4 /100 | #155 | Good 10.1% |
| Immigrants | Micronesia | 70.9 /100 | #156 | Good 10.1% |
| Australians | 70.6 /100 | #157 | Good 10.1% |
| Spanish American Indians | 70.2 /100 | #158 | Good 10.1% |
| Immigrants | Indonesia | 69.3 /100 | #159 | Good 10.1% |
Demographics Similar to Luxembourgers by No Vehicles in Household
In terms of no vehicles in household, the demographic groups most similar to Luxembourgers are Norwegian (6.4%, a difference of 20.2%), English (6.5%, a difference of 21.5%), Danish (6.6%, a difference of 23.0%), Yakama (6.6%, a difference of 23.4%), and German (6.7%, a difference of 24.6%).
| Demographics | Rating | Rank | No Vehicles in Household |
| Luxembourgers | 100.0 /100 | #1 | Exceptional 5.4% |
| Norwegians | 100.0 /100 | #2 | Exceptional 6.4% |
| English | 100.0 /100 | #3 | Exceptional 6.5% |
| Danes | 100.0 /100 | #4 | Exceptional 6.6% |
| Yakama | 100.0 /100 | #5 | Exceptional 6.6% |
| Germans | 100.0 /100 | #6 | Exceptional 6.7% |
| Scottish | 100.0 /100 | #7 | Exceptional 6.8% |
| Swedes | 100.0 /100 | #8 | Exceptional 6.8% |
| Scotch-Irish | 100.0 /100 | #9 | Exceptional 6.8% |
| Dutch | 100.0 /100 | #10 | Exceptional 6.8% |
| Czechs | 100.0 /100 | #11 | Exceptional 6.9% |
| Assyrians/Chaldeans/Syriacs | 100.0 /100 | #12 | Exceptional 7.0% |
| Scandinavians | 100.0 /100 | #13 | Exceptional 7.0% |
| Mexicans | 100.0 /100 | #14 | Exceptional 7.0% |
| Whites/Caucasians | 100.0 /100 | #15 | Exceptional 7.0% |