Assyrian/Chaldean/Syriac vs Luxembourger Unemployment Among Ages 60 to 64 years
COMPARE
Assyrian/Chaldean/Syriac
Luxembourger
Unemployment Among Ages 60 to 64 years
Unemployment Among Ages 60 to 64 years Comparison
Assyrians/Chaldeans/Syriacs
Luxembourgers
4.5%
UNEMPLOYMENT AMONG AGES 60 TO 64 YEARS
99.9/ 100
METRIC RATING
47th/ 347
METRIC RANK
4.3%
UNEMPLOYMENT AMONG AGES 60 TO 64 YEARS
100.0/ 100
METRIC RATING
11th/ 347
METRIC RANK
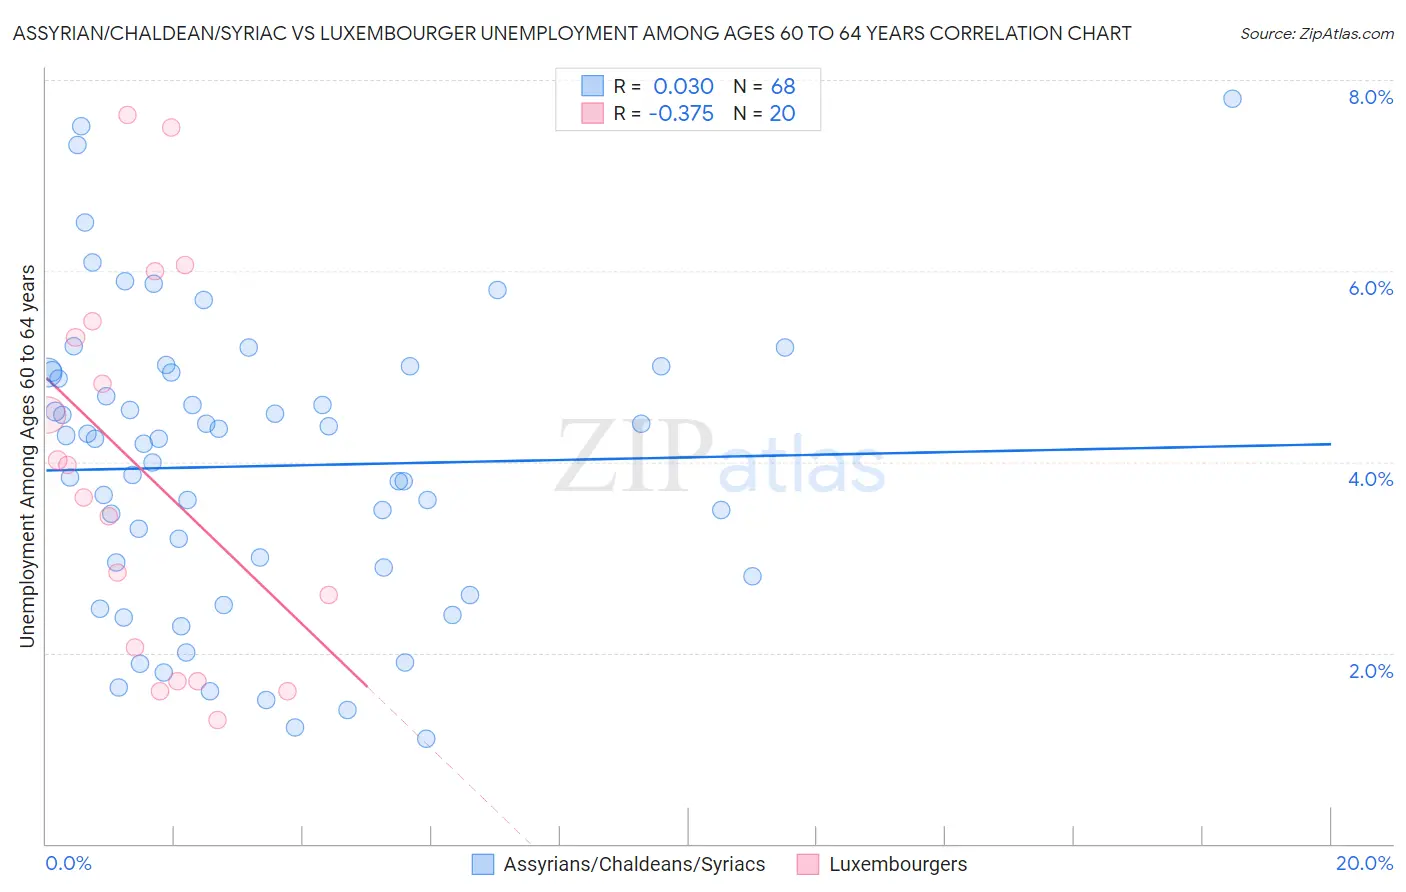
Assyrian/Chaldean/Syriac vs Luxembourger Unemployment Among Ages 60 to 64 years Correlation Chart
The statistical analysis conducted on geographies consisting of 107,458,902 people shows no correlation between the proportion of Assyrians/Chaldeans/Syriacs and unemployment rate among population between the ages 60 and 64 in the United States with a correlation coefficient (R) of 0.030 and weighted average of 4.5%. Similarly, the statistical analysis conducted on geographies consisting of 136,276,430 people shows a mild negative correlation between the proportion of Luxembourgers and unemployment rate among population between the ages 60 and 64 in the United States with a correlation coefficient (R) of -0.375 and weighted average of 4.3%, a difference of 6.2%.
Unemployment Among Ages 60 to 64 years Correlation Summary
| Measurement | Assyrian/Chaldean/Syriac | Luxembourger |
| Minimum | 1.1% | 1.3% |
| Maximum | 7.8% | 7.6% |
| Range | 6.7% | 6.3% |
| Mean | 4.0% | 3.9% |
| Median | 4.2% | 3.8% |
| Interquartile 25% (IQ1) | 2.9% | 1.9% |
| Interquartile 75% (IQ3) | 4.9% | 5.4% |
| Interquartile Range (IQR) | 2.1% | 3.5% |
| Standard Deviation (Sample) | 1.5% | 2.0% |
| Standard Deviation (Population) | 1.5% | 1.9% |
Similar Demographics by Unemployment Among Ages 60 to 64 years
Demographics Similar to Assyrians/Chaldeans/Syriacs by Unemployment Among Ages 60 to 64 years
In terms of unemployment among ages 60 to 64 years, the demographic groups most similar to Assyrians/Chaldeans/Syriacs are Bhutanese (4.5%, a difference of 0.19%), Immigrants from Zimbabwe (4.6%, a difference of 0.22%), Liberian (4.5%, a difference of 0.27%), Scotch-Irish (4.6%, a difference of 0.27%), and Scottish (4.6%, a difference of 0.30%).
| Demographics | Rating | Rank | Unemployment Among Ages 60 to 64 years |
| Scandinavians | 100.0 /100 | #40 | Exceptional 4.5% |
| Immigrants | Sudan | 100.0 /100 | #41 | Exceptional 4.5% |
| English | 100.0 /100 | #42 | Exceptional 4.5% |
| Swedes | 100.0 /100 | #43 | Exceptional 4.5% |
| Europeans | 100.0 /100 | #44 | Exceptional 4.5% |
| Liberians | 99.9 /100 | #45 | Exceptional 4.5% |
| Bhutanese | 99.9 /100 | #46 | Exceptional 4.5% |
| Assyrians/Chaldeans/Syriacs | 99.9 /100 | #47 | Exceptional 4.5% |
| Immigrants | Zimbabwe | 99.9 /100 | #48 | Exceptional 4.6% |
| Scotch-Irish | 99.9 /100 | #49 | Exceptional 4.6% |
| Scottish | 99.9 /100 | #50 | Exceptional 4.6% |
| Immigrants | Kenya | 99.9 /100 | #51 | Exceptional 4.6% |
| Kenyans | 99.9 /100 | #52 | Exceptional 4.6% |
| Immigrants | Moldova | 99.9 /100 | #53 | Exceptional 4.6% |
| Dutch | 99.9 /100 | #54 | Exceptional 4.6% |
Demographics Similar to Luxembourgers by Unemployment Among Ages 60 to 64 years
In terms of unemployment among ages 60 to 64 years, the demographic groups most similar to Luxembourgers are Immigrants from Bosnia and Herzegovina (4.2%, a difference of 0.74%), Immigrants from Cuba (4.3%, a difference of 1.0%), Chickasaw (4.3%, a difference of 1.0%), Norwegian (4.3%, a difference of 1.1%), and Indonesian (4.2%, a difference of 1.1%).
| Demographics | Rating | Rank | Unemployment Among Ages 60 to 64 years |
| Hmong | 100.0 /100 | #4 | Exceptional 4.0% |
| Immigrants | Azores | 100.0 /100 | #5 | Exceptional 4.0% |
| Immigrants | Congo | 100.0 /100 | #6 | Exceptional 4.1% |
| Lumbee | 100.0 /100 | #7 | Exceptional 4.2% |
| Immigrants | Micronesia | 100.0 /100 | #8 | Exceptional 4.2% |
| Indonesians | 100.0 /100 | #9 | Exceptional 4.2% |
| Immigrants | Bosnia and Herzegovina | 100.0 /100 | #10 | Exceptional 4.2% |
| Luxembourgers | 100.0 /100 | #11 | Exceptional 4.3% |
| Immigrants | Cuba | 100.0 /100 | #12 | Exceptional 4.3% |
| Chickasaw | 100.0 /100 | #13 | Exceptional 4.3% |
| Norwegians | 100.0 /100 | #14 | Exceptional 4.3% |
| Sudanese | 100.0 /100 | #15 | Exceptional 4.3% |
| Danes | 100.0 /100 | #16 | Exceptional 4.4% |
| Immigrants | Afghanistan | 100.0 /100 | #17 | Exceptional 4.4% |
| Slovenes | 100.0 /100 | #18 | Exceptional 4.4% |