Asian vs Japanese 3 or more Vehicles in Household
COMPARE
Asian
Japanese
3 or more Vehicles in Household
3 or more Vehicles in Household Comparison
Asians
Japanese
20.8%
3 OR MORE VEHICLES IN HOUSEHOLD
96.8/ 100
METRIC RATING
110th/ 347
METRIC RANK
21.8%
3 OR MORE VEHICLES IN HOUSEHOLD
99.8/ 100
METRIC RATING
75th/ 347
METRIC RANK
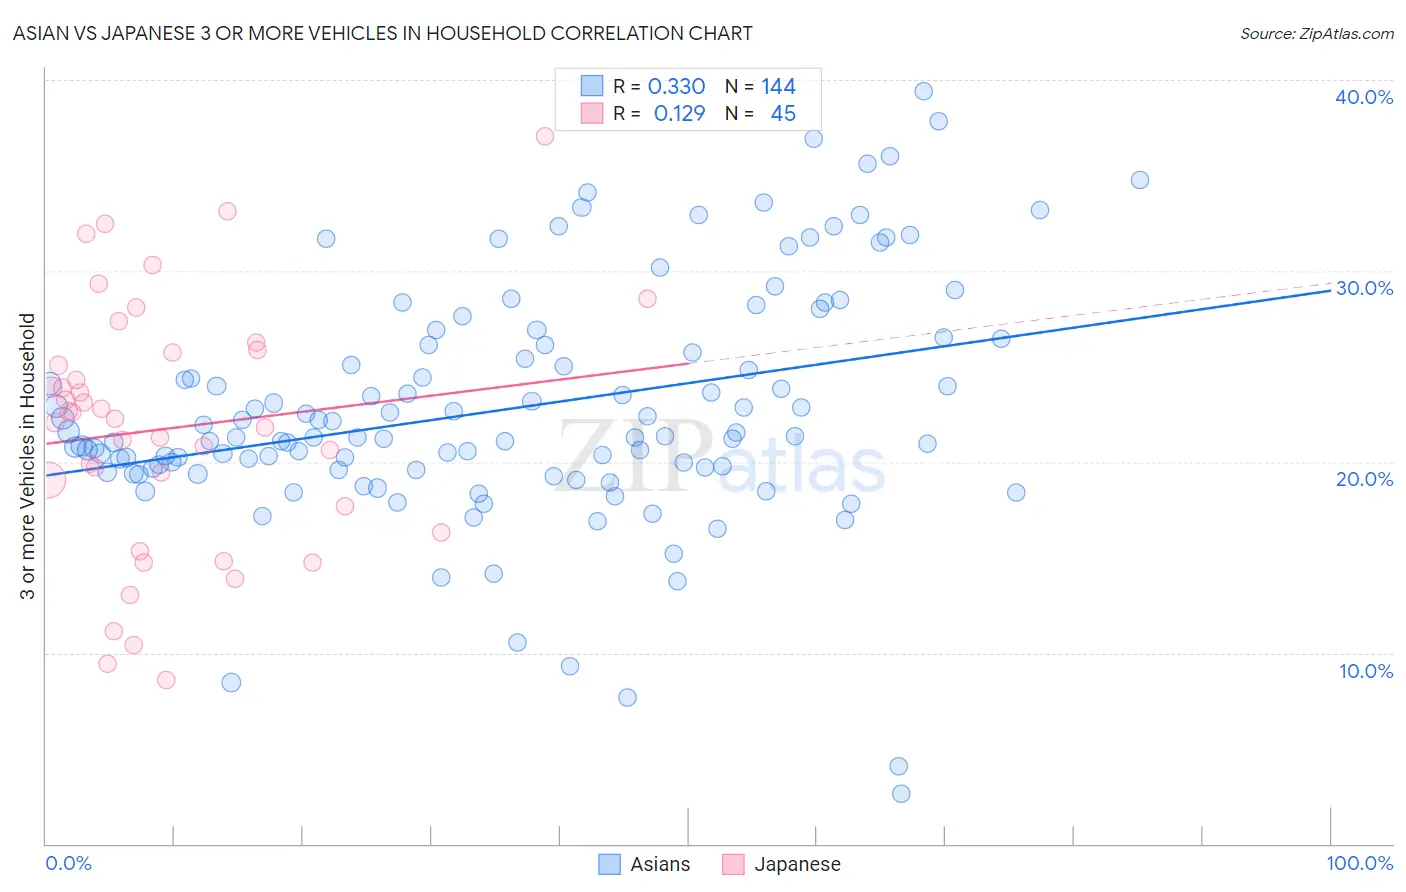
Asian vs Japanese 3 or more Vehicles in Household Correlation Chart
The statistical analysis conducted on geographies consisting of 549,911,489 people shows a mild positive correlation between the proportion of Asians and percentage of households with 3 or more vehicles available in the United States with a correlation coefficient (R) of 0.330 and weighted average of 20.8%. Similarly, the statistical analysis conducted on geographies consisting of 249,016,700 people shows a poor positive correlation between the proportion of Japanese and percentage of households with 3 or more vehicles available in the United States with a correlation coefficient (R) of 0.129 and weighted average of 21.8%, a difference of 4.9%.
3 or more Vehicles in Household Correlation Summary
| Measurement | Asian | Japanese |
| Minimum | 2.6% | 8.6% |
| Maximum | 39.4% | 37.0% |
| Range | 36.8% | 28.5% |
| Mean | 22.8% | 21.8% |
| Median | 21.3% | 22.3% |
| Interquartile 25% (IQ1) | 19.6% | 17.0% |
| Interquartile 75% (IQ3) | 26.1% | 25.8% |
| Interquartile Range (IQR) | 6.5% | 8.8% |
| Standard Deviation (Sample) | 6.3% | 6.5% |
| Standard Deviation (Population) | 6.2% | 6.5% |
Similar Demographics by 3 or more Vehicles in Household
Demographics Similar to Asians by 3 or more Vehicles in Household
In terms of 3 or more vehicles in household, the demographic groups most similar to Asians are Immigrants from Micronesia (20.7%, a difference of 0.030%), Filipino (20.8%, a difference of 0.14%), Immigrants from Scotland (20.8%, a difference of 0.20%), Nicaraguan (20.7%, a difference of 0.32%), and Immigrants from England (20.7%, a difference of 0.33%).
| Demographics | Rating | Rank | 3 or more Vehicles in Household |
| Dutch West Indians | 97.8 /100 | #103 | Exceptional 20.9% |
| Luxembourgers | 97.7 /100 | #104 | Exceptional 20.9% |
| Austrians | 97.5 /100 | #105 | Exceptional 20.9% |
| Bolivians | 97.4 /100 | #106 | Exceptional 20.8% |
| Immigrants | Germany | 97.4 /100 | #107 | Exceptional 20.8% |
| Immigrants | Scotland | 97.1 /100 | #108 | Exceptional 20.8% |
| Filipinos | 97.0 /100 | #109 | Exceptional 20.8% |
| Asians | 96.8 /100 | #110 | Exceptional 20.8% |
| Immigrants | Micronesia | 96.7 /100 | #111 | Exceptional 20.7% |
| Nicaraguans | 96.2 /100 | #112 | Exceptional 20.7% |
| Immigrants | England | 96.2 /100 | #113 | Exceptional 20.7% |
| Burmese | 95.8 /100 | #114 | Exceptional 20.6% |
| French Canadians | 95.0 /100 | #115 | Exceptional 20.6% |
| Italians | 94.9 /100 | #116 | Exceptional 20.6% |
| Croatians | 94.9 /100 | #117 | Exceptional 20.6% |
Demographics Similar to Japanese by 3 or more Vehicles in Household
In terms of 3 or more vehicles in household, the demographic groups most similar to Japanese are Nonimmigrants (21.8%, a difference of 0.040%), Immigrants from Oceania (21.8%, a difference of 0.10%), Salvadoran (21.8%, a difference of 0.12%), Irish (21.8%, a difference of 0.12%), and Portuguese (21.8%, a difference of 0.21%).
| Demographics | Rating | Rank | 3 or more Vehicles in Household |
| British | 99.9 /100 | #68 | Exceptional 21.9% |
| Creek | 99.9 /100 | #69 | Exceptional 21.9% |
| Bangladeshis | 99.8 /100 | #70 | Exceptional 21.9% |
| Potawatomi | 99.8 /100 | #71 | Exceptional 21.9% |
| Portuguese | 99.8 /100 | #72 | Exceptional 21.8% |
| Salvadorans | 99.8 /100 | #73 | Exceptional 21.8% |
| Immigrants | Oceania | 99.8 /100 | #74 | Exceptional 21.8% |
| Japanese | 99.8 /100 | #75 | Exceptional 21.8% |
| Immigrants | Nonimmigrants | 99.8 /100 | #76 | Exceptional 21.8% |
| Irish | 99.8 /100 | #77 | Exceptional 21.8% |
| Czechoslovakians | 99.8 /100 | #78 | Exceptional 21.7% |
| Assyrians/Chaldeans/Syriacs | 99.8 /100 | #79 | Exceptional 21.7% |
| Afghans | 99.7 /100 | #80 | Exceptional 21.7% |
| Celtics | 99.7 /100 | #81 | Exceptional 21.7% |
| Immigrants | El Salvador | 99.6 /100 | #82 | Exceptional 21.5% |