Arapaho vs Bolivian 2 or more Vehicles in Household
COMPARE
Arapaho
Bolivian
2 or more Vehicles in Household
2 or more Vehicles in Household Comparison
Arapaho
Bolivians
60.2%
2 OR MORE VEHICLES IN HOUSEHOLD
100.0/ 100
METRIC RATING
32nd/ 347
METRIC RANK
58.3%
2 OR MORE VEHICLES IN HOUSEHOLD
99.6/ 100
METRIC RATING
73rd/ 347
METRIC RANK
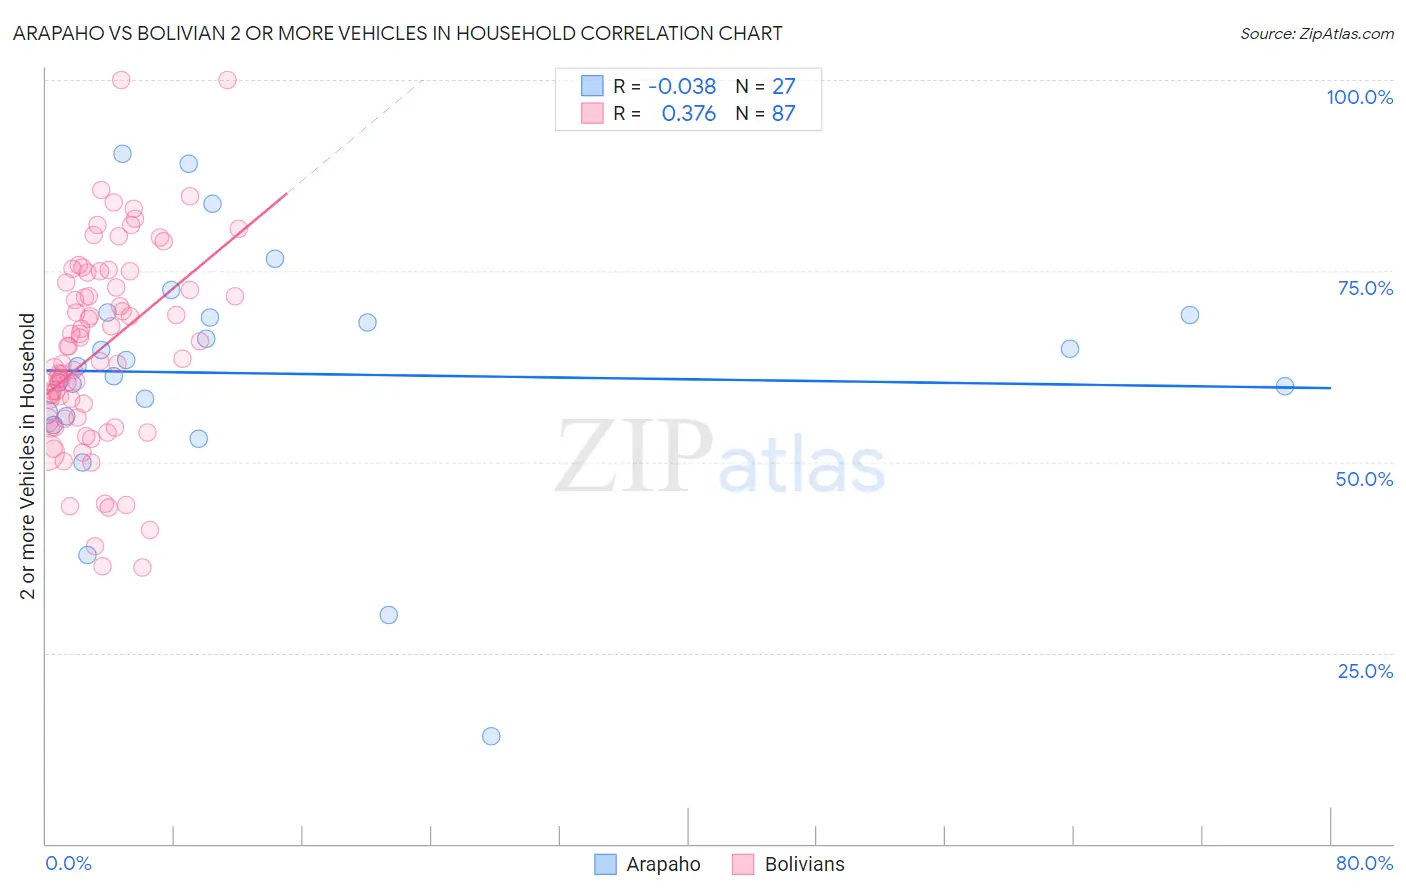
Arapaho vs Bolivian 2 or more Vehicles in Household Correlation Chart
The statistical analysis conducted on geographies consisting of 29,778,572 people shows no correlation between the proportion of Arapaho and percentage of households with 2 or more vehicles available in the United States with a correlation coefficient (R) of -0.038 and weighted average of 60.2%. Similarly, the statistical analysis conducted on geographies consisting of 184,629,947 people shows a mild positive correlation between the proportion of Bolivians and percentage of households with 2 or more vehicles available in the United States with a correlation coefficient (R) of 0.376 and weighted average of 58.3%, a difference of 3.3%.
2 or more Vehicles in Household Correlation Summary
| Measurement | Arapaho | Bolivian |
| Minimum | 14.1% | 36.2% |
| Maximum | 90.3% | 100.0% |
| Range | 76.2% | 63.8% |
| Mean | 61.5% | 64.7% |
| Median | 62.5% | 63.5% |
| Interquartile 25% (IQ1) | 56.0% | 55.7% |
| Interquartile 75% (IQ3) | 69.3% | 73.5% |
| Interquartile Range (IQR) | 13.3% | 17.9% |
| Standard Deviation (Sample) | 16.2% | 12.9% |
| Standard Deviation (Population) | 15.9% | 12.8% |
Similar Demographics by 2 or more Vehicles in Household
Demographics Similar to Arapaho by 2 or more Vehicles in Household
In terms of 2 or more vehicles in household, the demographic groups most similar to Arapaho are Immigrants from Mexico (60.2%, a difference of 0.060%), Spanish American Indian (60.3%, a difference of 0.11%), Spanish (60.2%, a difference of 0.11%), Finnish (60.3%, a difference of 0.13%), and Immigrants from Philippines (60.1%, a difference of 0.23%).
| Demographics | Rating | Rank | 2 or more Vehicles in Household |
| Whites/Caucasians | 100.0 /100 | #25 | Exceptional 60.8% |
| Welsh | 100.0 /100 | #26 | Exceptional 60.8% |
| Assyrians/Chaldeans/Syriacs | 100.0 /100 | #27 | Exceptional 60.5% |
| Guamanians/Chamorros | 100.0 /100 | #28 | Exceptional 60.5% |
| Hawaiians | 100.0 /100 | #29 | Exceptional 60.4% |
| Finns | 100.0 /100 | #30 | Exceptional 60.3% |
| Spanish American Indians | 100.0 /100 | #31 | Exceptional 60.3% |
| Arapaho | 100.0 /100 | #32 | Exceptional 60.2% |
| Immigrants | Mexico | 100.0 /100 | #33 | Exceptional 60.2% |
| Spanish | 100.0 /100 | #34 | Exceptional 60.2% |
| Immigrants | Philippines | 100.0 /100 | #35 | Exceptional 60.1% |
| Chinese | 100.0 /100 | #36 | Exceptional 60.1% |
| Irish | 100.0 /100 | #37 | Exceptional 60.1% |
| Americans | 100.0 /100 | #38 | Exceptional 60.0% |
| British | 100.0 /100 | #39 | Exceptional 60.0% |
Demographics Similar to Bolivians by 2 or more Vehicles in Household
In terms of 2 or more vehicles in household, the demographic groups most similar to Bolivians are Immigrants from Afghanistan (58.3%, a difference of 0.0%), Polish (58.3%, a difference of 0.080%), Austrian (58.4%, a difference of 0.12%), Creek (58.3%, a difference of 0.12%), and Slovene (58.3%, a difference of 0.12%).
| Demographics | Rating | Rank | 2 or more Vehicles in Household |
| Croatians | 99.7 /100 | #66 | Exceptional 58.6% |
| Laotians | 99.7 /100 | #67 | Exceptional 58.6% |
| Canadians | 99.7 /100 | #68 | Exceptional 58.6% |
| Pennsylvania Germans | 99.7 /100 | #69 | Exceptional 58.5% |
| Italians | 99.6 /100 | #70 | Exceptional 58.4% |
| Bangladeshis | 99.6 /100 | #71 | Exceptional 58.4% |
| Austrians | 99.6 /100 | #72 | Exceptional 58.4% |
| Bolivians | 99.6 /100 | #73 | Exceptional 58.3% |
| Immigrants | Afghanistan | 99.6 /100 | #74 | Exceptional 58.3% |
| Poles | 99.5 /100 | #75 | Exceptional 58.3% |
| Creek | 99.5 /100 | #76 | Exceptional 58.3% |
| Slovenes | 99.5 /100 | #77 | Exceptional 58.3% |
| Lithuanians | 99.5 /100 | #78 | Exceptional 58.2% |
| Delaware | 99.4 /100 | #79 | Exceptional 58.2% |
| Immigrants | England | 99.3 /100 | #80 | Exceptional 58.1% |