American vs Immigrants from Zaire Family Households
COMPARE
American
Immigrants from Zaire
Family Households
Family Households Comparison
Americans
Immigrants from Zaire
65.5%
FAMILY HOUSEHOLDS
99.6/ 100
METRIC RATING
84th/ 347
METRIC RANK
59.2%
FAMILY HOUSEHOLDS
0.0/ 100
METRIC RATING
345th/ 347
METRIC RANK
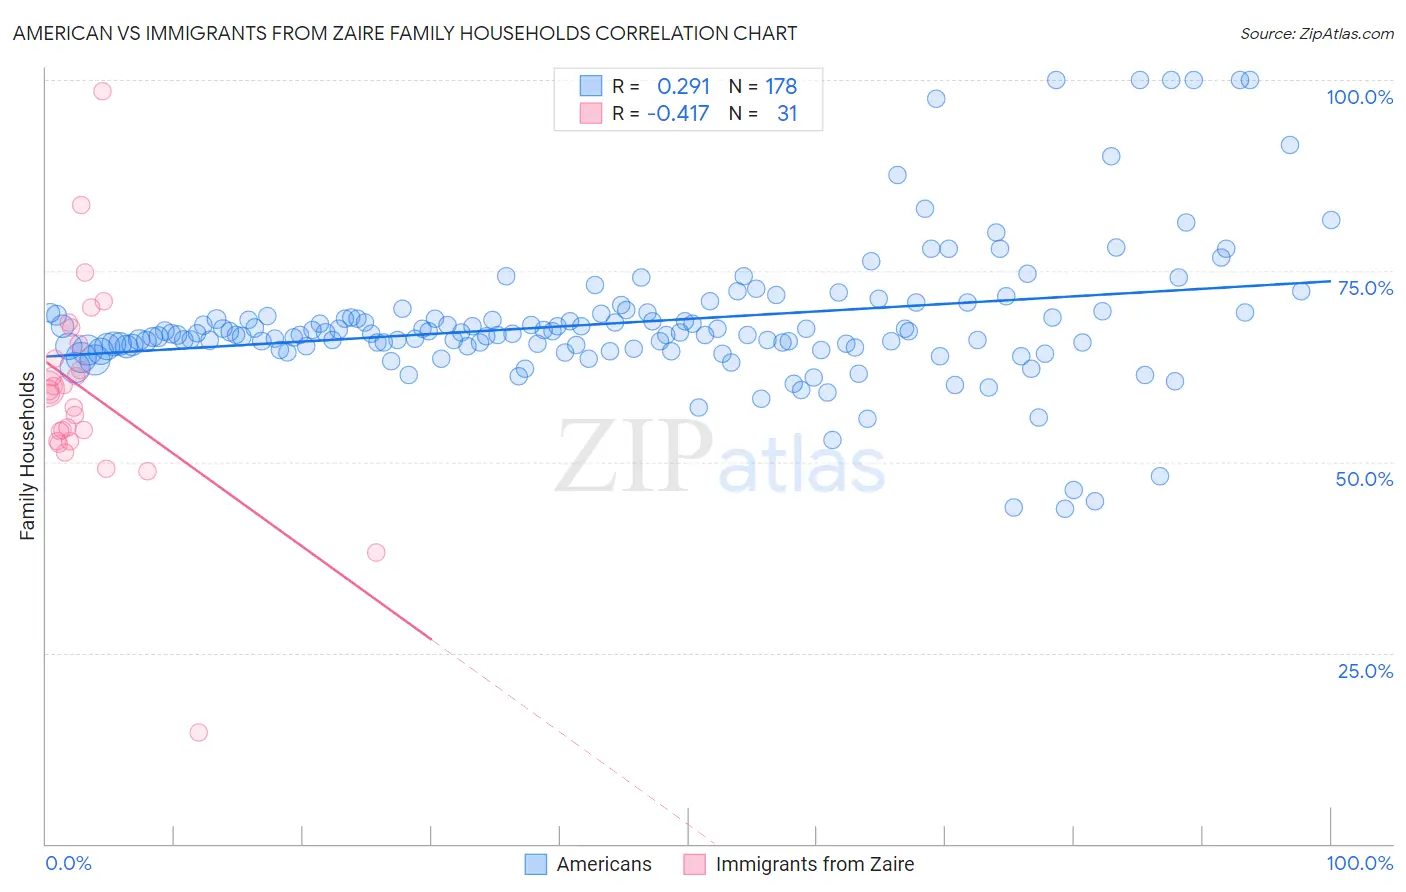
American vs Immigrants from Zaire Family Households Correlation Chart
The statistical analysis conducted on geographies consisting of 581,387,036 people shows a weak positive correlation between the proportion of Americans and percentage of family households in the United States with a correlation coefficient (R) of 0.291 and weighted average of 65.5%. Similarly, the statistical analysis conducted on geographies consisting of 107,246,225 people shows a moderate negative correlation between the proportion of Immigrants from Zaire and percentage of family households in the United States with a correlation coefficient (R) of -0.417 and weighted average of 59.2%, a difference of 10.7%.
Family Households Correlation Summary
| Measurement | American | Immigrants from Zaire |
| Minimum | 43.9% | 14.5% |
| Maximum | 100.0% | 98.6% |
| Range | 56.1% | 84.1% |
| Mean | 68.2% | 59.2% |
| Median | 66.7% | 59.4% |
| Interquartile 25% (IQ1) | 65.1% | 52.7% |
| Interquartile 75% (IQ3) | 69.3% | 65.5% |
| Interquartile Range (IQR) | 4.2% | 12.8% |
| Standard Deviation (Sample) | 9.1% | 14.0% |
| Standard Deviation (Population) | 9.1% | 13.7% |
Similar Demographics by Family Households
Demographics Similar to Americans by Family Households
In terms of family households, the demographic groups most similar to Americans are Immigrants from Guyana (65.5%, a difference of 0.020%), Immigrants from Lebanon (65.5%, a difference of 0.030%), Jordanian (65.5%, a difference of 0.060%), Immigrants from Cambodia (65.4%, a difference of 0.11%), and Puget Sound Salish (65.6%, a difference of 0.14%).
| Demographics | Rating | Rank | Family Households |
| Immigrants | South America | 99.8 /100 | #77 | Exceptional 65.6% |
| Yaqui | 99.8 /100 | #78 | Exceptional 65.6% |
| Immigrants | Costa Rica | 99.8 /100 | #79 | Exceptional 65.6% |
| Puget Sound Salish | 99.8 /100 | #80 | Exceptional 65.6% |
| Jordanians | 99.7 /100 | #81 | Exceptional 65.5% |
| Immigrants | Lebanon | 99.7 /100 | #82 | Exceptional 65.5% |
| Immigrants | Guyana | 99.6 /100 | #83 | Exceptional 65.5% |
| Americans | 99.6 /100 | #84 | Exceptional 65.5% |
| Immigrants | Cambodia | 99.5 /100 | #85 | Exceptional 65.4% |
| Egyptians | 99.4 /100 | #86 | Exceptional 65.4% |
| Immigrants | Egypt | 99.2 /100 | #87 | Exceptional 65.3% |
| Immigrants | Haiti | 99.1 /100 | #88 | Exceptional 65.3% |
| Immigrants | Caribbean | 99.1 /100 | #89 | Exceptional 65.3% |
| Immigrants | Laos | 99.1 /100 | #90 | Exceptional 65.3% |
| Crow | 98.9 /100 | #91 | Exceptional 65.3% |
Demographics Similar to Immigrants from Zaire by Family Households
In terms of family households, the demographic groups most similar to Immigrants from Zaire are Immigrants from Congo (59.2%, a difference of 0.14%), Senegalese (59.8%, a difference of 1.1%), Sudanese (60.0%, a difference of 1.4%), Immigrants from Senegal (60.1%, a difference of 1.6%), and Immigrants from Sudan (60.2%, a difference of 1.7%).
| Demographics | Rating | Rank | Family Households |
| Immigrants | Ethiopia | 0.0 /100 | #333 | Tragic 61.2% |
| Immigrants | Eastern Africa | 0.0 /100 | #334 | Tragic 61.1% |
| Carpatho Rusyns | 0.0 /100 | #335 | Tragic 61.1% |
| German Russians | 0.0 /100 | #336 | Tragic 60.9% |
| Soviet Union | 0.0 /100 | #337 | Tragic 60.9% |
| Immigrants | Eritrea | 0.0 /100 | #338 | Tragic 60.8% |
| Immigrants | Saudi Arabia | 0.0 /100 | #339 | Tragic 60.7% |
| Immigrants | Sudan | 0.0 /100 | #340 | Tragic 60.2% |
| Immigrants | Senegal | 0.0 /100 | #341 | Tragic 60.1% |
| Sudanese | 0.0 /100 | #342 | Tragic 60.0% |
| Senegalese | 0.0 /100 | #343 | Tragic 59.8% |
| Immigrants | Congo | 0.0 /100 | #344 | Tragic 59.2% |
| Immigrants | Zaire | 0.0 /100 | #345 | Tragic 59.2% |
| Somalis | 0.0 /100 | #346 | Tragic 57.6% |
| Immigrants | Somalia | 0.0 /100 | #347 | Tragic 56.7% |