Aleut vs Immigrants from Malaysia Unemployment Among Ages 16 to 19 years
COMPARE
Aleut
Immigrants from Malaysia
Unemployment Among Ages 16 to 19 years
Unemployment Among Ages 16 to 19 years Comparison
Aleuts
Immigrants from Malaysia
21.2%
UNEMPLOYMENT AMONG AGES 16 TO 19 YEARS
0.0/ 100
METRIC RATING
304th/ 347
METRIC RANK
17.2%
UNEMPLOYMENT AMONG AGES 16 TO 19 YEARS
82.8/ 100
METRIC RATING
137th/ 347
METRIC RANK
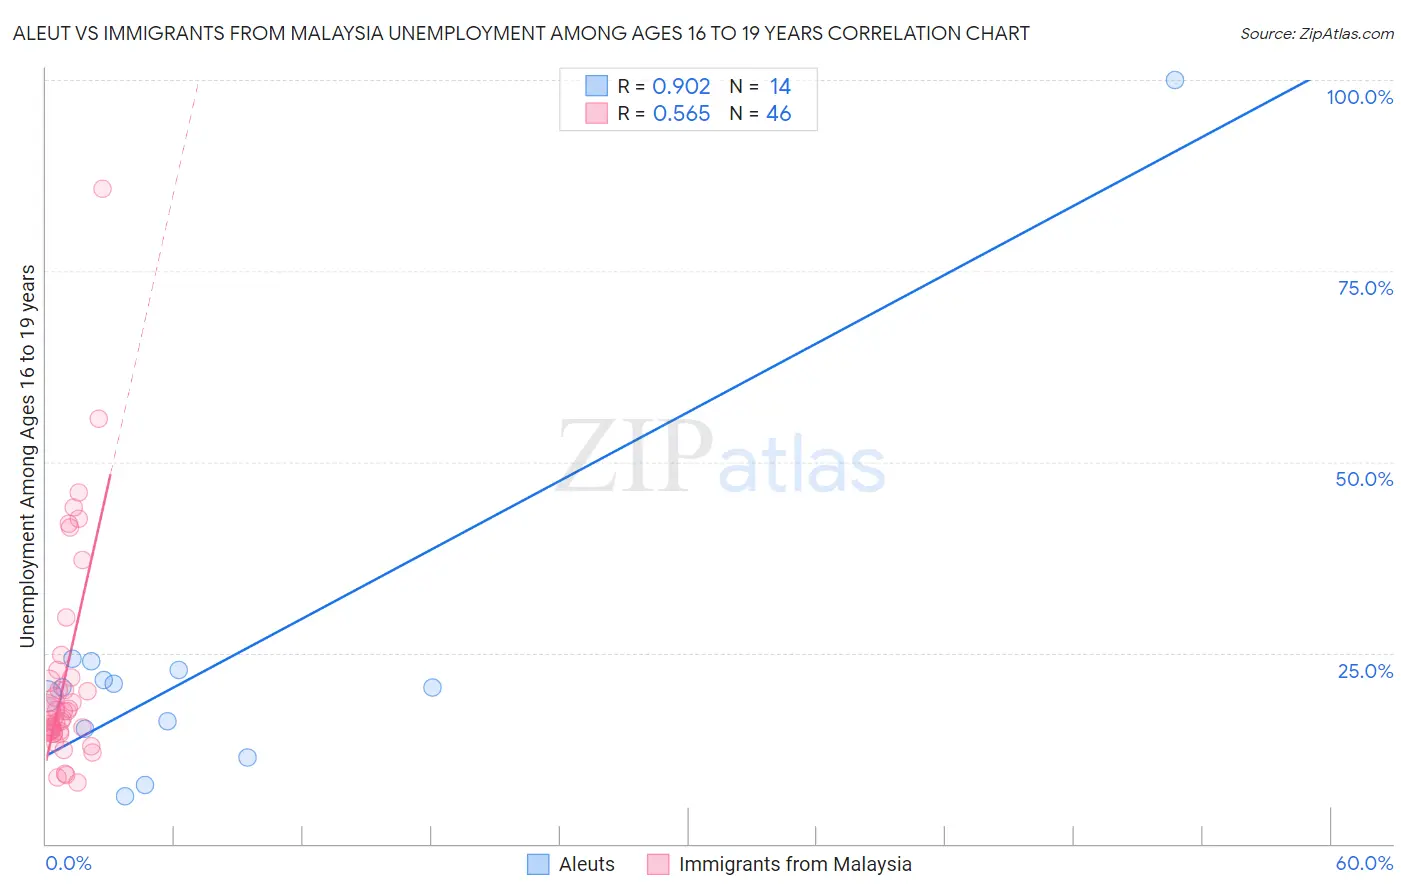
Aleut vs Immigrants from Malaysia Unemployment Among Ages 16 to 19 years Correlation Chart
The statistical analysis conducted on geographies consisting of 60,781,388 people shows a near-perfect positive correlation between the proportion of Aleuts and unemployment rate among population between the ages 16 and 19 in the United States with a correlation coefficient (R) of 0.902 and weighted average of 21.2%. Similarly, the statistical analysis conducted on geographies consisting of 193,079,858 people shows a substantial positive correlation between the proportion of Immigrants from Malaysia and unemployment rate among population between the ages 16 and 19 in the United States with a correlation coefficient (R) of 0.565 and weighted average of 17.2%, a difference of 22.6%.
Unemployment Among Ages 16 to 19 years Correlation Summary
| Measurement | Aleut | Immigrants from Malaysia |
| Minimum | 6.2% | 8.1% |
| Maximum | 100.0% | 85.7% |
| Range | 93.8% | 77.6% |
| Mean | 23.6% | 22.1% |
| Median | 20.4% | 17.2% |
| Interquartile 25% (IQ1) | 15.1% | 14.8% |
| Interquartile 75% (IQ3) | 22.8% | 21.8% |
| Interquartile Range (IQR) | 7.7% | 7.0% |
| Standard Deviation (Sample) | 22.7% | 14.6% |
| Standard Deviation (Population) | 21.9% | 14.4% |
Similar Demographics by Unemployment Among Ages 16 to 19 years
Demographics Similar to Aleuts by Unemployment Among Ages 16 to 19 years
In terms of unemployment among ages 16 to 19 years, the demographic groups most similar to Aleuts are Immigrants from Senegal (21.2%, a difference of 0.16%), U.S. Virgin Islander (21.3%, a difference of 0.56%), Senegalese (21.0%, a difference of 0.86%), Black/African American (21.4%, a difference of 1.1%), and Immigrants from Caribbean (20.9%, a difference of 1.2%).
| Demographics | Rating | Rank | Unemployment Among Ages 16 to 19 years |
| Alsatians | 0.0 /100 | #297 | Tragic 20.5% |
| Haitians | 0.0 /100 | #298 | Tragic 20.5% |
| Immigrants | Uzbekistan | 0.0 /100 | #299 | Tragic 20.5% |
| Ecuadorians | 0.0 /100 | #300 | Tragic 20.5% |
| Immigrants | Ecuador | 0.0 /100 | #301 | Tragic 20.9% |
| Immigrants | Caribbean | 0.0 /100 | #302 | Tragic 20.9% |
| Senegalese | 0.0 /100 | #303 | Tragic 21.0% |
| Aleuts | 0.0 /100 | #304 | Tragic 21.2% |
| Immigrants | Senegal | 0.0 /100 | #305 | Tragic 21.2% |
| U.S. Virgin Islanders | 0.0 /100 | #306 | Tragic 21.3% |
| Blacks/African Americans | 0.0 /100 | #307 | Tragic 21.4% |
| Immigrants | Bangladesh | 0.0 /100 | #308 | Tragic 21.5% |
| Natives/Alaskans | 0.0 /100 | #309 | Tragic 21.5% |
| Vietnamese | 0.0 /100 | #310 | Tragic 21.5% |
| Belizeans | 0.0 /100 | #311 | Tragic 21.6% |
Demographics Similar to Immigrants from Malaysia by Unemployment Among Ages 16 to 19 years
In terms of unemployment among ages 16 to 19 years, the demographic groups most similar to Immigrants from Malaysia are Immigrants from Oceania (17.2%, a difference of 0.020%), Bolivian (17.3%, a difference of 0.070%), Samoan (17.2%, a difference of 0.080%), Laotian (17.2%, a difference of 0.090%), and Potawatomi (17.2%, a difference of 0.090%).
| Demographics | Rating | Rank | Unemployment Among Ages 16 to 19 years |
| Immigrants | Indonesia | 84.7 /100 | #130 | Excellent 17.2% |
| German Russians | 84.1 /100 | #131 | Excellent 17.2% |
| Arabs | 83.9 /100 | #132 | Excellent 17.2% |
| Laotians | 83.9 /100 | #133 | Excellent 17.2% |
| Potawatomi | 83.8 /100 | #134 | Excellent 17.2% |
| Samoans | 83.7 /100 | #135 | Excellent 17.2% |
| Immigrants | Oceania | 83.1 /100 | #136 | Excellent 17.2% |
| Immigrants | Malaysia | 82.8 /100 | #137 | Excellent 17.2% |
| Bolivians | 81.9 /100 | #138 | Excellent 17.3% |
| Immigrants | Eritrea | 81.1 /100 | #139 | Excellent 17.3% |
| Immigrants | Croatia | 80.8 /100 | #140 | Excellent 17.3% |
| Basques | 80.7 /100 | #141 | Excellent 17.3% |
| Spanish | 79.3 /100 | #142 | Good 17.3% |
| Immigrants | Egypt | 79.1 /100 | #143 | Good 17.3% |
| Immigrants | England | 78.9 /100 | #144 | Good 17.3% |