Aleut vs Ghanaian 3 or more Vehicles in Household
COMPARE
Aleut
Ghanaian
3 or more Vehicles in Household
3 or more Vehicles in Household Comparison
Aleuts
Ghanaians
20.2%
3 OR MORE VEHICLES IN HOUSEHOLD
86.3/ 100
METRIC RATING
138th/ 347
METRIC RANK
16.4%
3 OR MORE VEHICLES IN HOUSEHOLD
0.0/ 100
METRIC RATING
304th/ 347
METRIC RANK
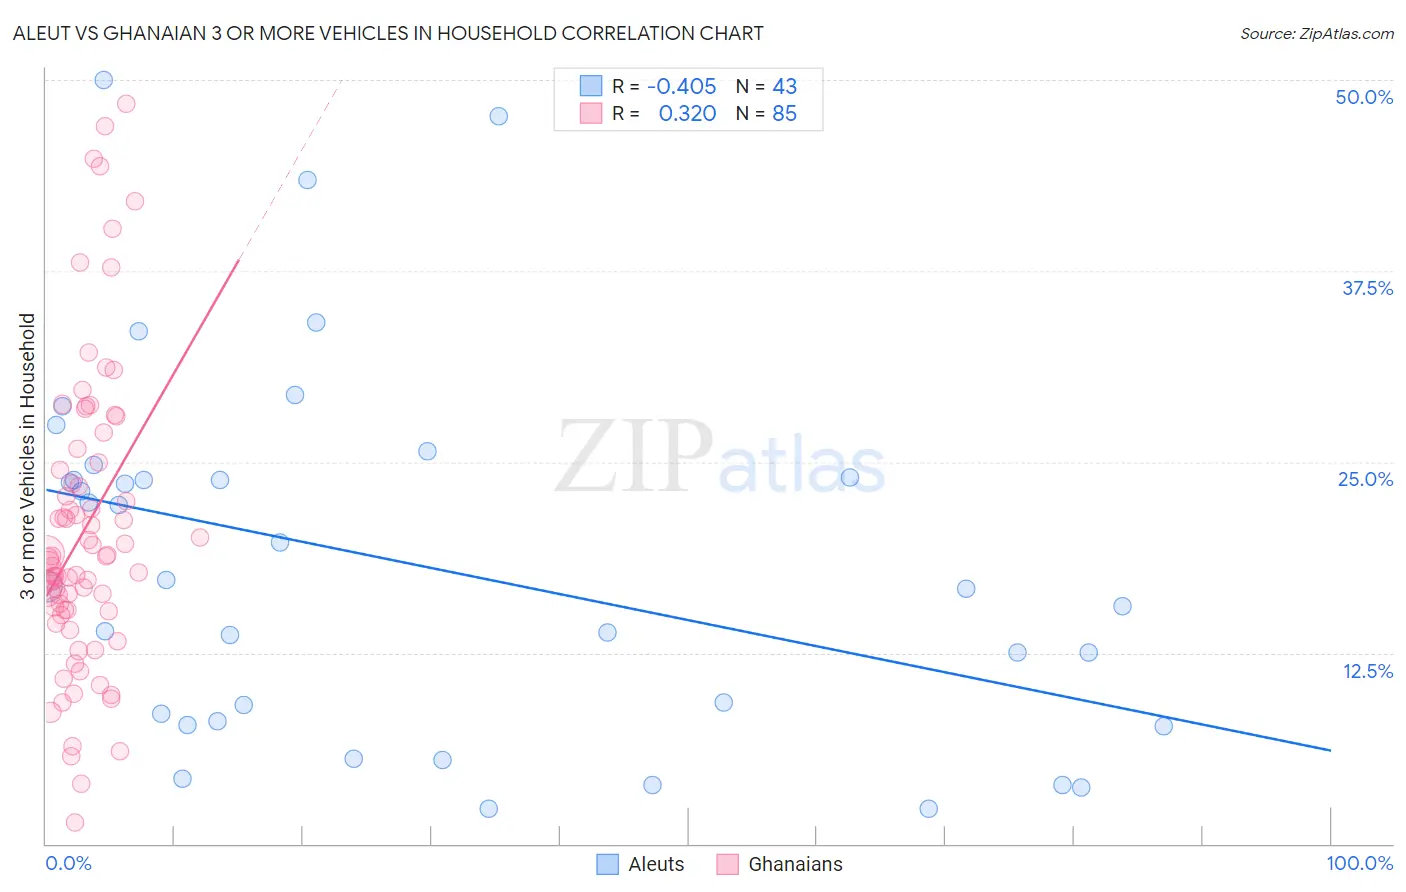
Aleut vs Ghanaian 3 or more Vehicles in Household Correlation Chart
The statistical analysis conducted on geographies consisting of 61,759,938 people shows a moderate negative correlation between the proportion of Aleuts and percentage of households with 3 or more vehicles available in the United States with a correlation coefficient (R) of -0.405 and weighted average of 20.2%. Similarly, the statistical analysis conducted on geographies consisting of 190,488,118 people shows a mild positive correlation between the proportion of Ghanaians and percentage of households with 3 or more vehicles available in the United States with a correlation coefficient (R) of 0.320 and weighted average of 16.4%, a difference of 23.4%.
3 or more Vehicles in Household Correlation Summary
| Measurement | Aleut | Ghanaian |
| Minimum | 2.3% | 1.4% |
| Maximum | 50.0% | 48.5% |
| Range | 47.7% | 47.1% |
| Mean | 18.3% | 20.5% |
| Median | 16.8% | 18.7% |
| Interquartile 25% (IQ1) | 8.0% | 15.3% |
| Interquartile 75% (IQ3) | 24.0% | 24.7% |
| Interquartile Range (IQR) | 16.0% | 9.4% |
| Standard Deviation (Sample) | 12.0% | 9.7% |
| Standard Deviation (Population) | 11.8% | 9.7% |
Similar Demographics by 3 or more Vehicles in Household
Demographics Similar to Aleuts by 3 or more Vehicles in Household
In terms of 3 or more vehicles in household, the demographic groups most similar to Aleuts are Immigrants from Nicaragua (20.2%, a difference of 0.12%), Immigrants from Iraq (20.2%, a difference of 0.12%), Slovene (20.2%, a difference of 0.12%), Immigrants from India (20.2%, a difference of 0.13%), and French American Indian (20.1%, a difference of 0.15%).
| Demographics | Rating | Rank | 3 or more Vehicles in Household |
| Immigrants | Asia | 88.1 /100 | #131 | Excellent 20.2% |
| Immigrants | Canada | 87.8 /100 | #132 | Excellent 20.2% |
| Immigrants | North America | 87.8 /100 | #133 | Excellent 20.2% |
| Poles | 87.3 /100 | #134 | Excellent 20.2% |
| Immigrants | India | 87.2 /100 | #135 | Excellent 20.2% |
| Immigrants | Nicaragua | 87.1 /100 | #136 | Excellent 20.2% |
| Immigrants | Iraq | 87.1 /100 | #137 | Excellent 20.2% |
| Aleuts | 86.3 /100 | #138 | Excellent 20.2% |
| Slovenes | 85.5 /100 | #139 | Excellent 20.2% |
| French American Indians | 85.3 /100 | #140 | Excellent 20.1% |
| Ottawa | 84.9 /100 | #141 | Excellent 20.1% |
| Jordanians | 84.4 /100 | #142 | Excellent 20.1% |
| Lithuanians | 84.4 /100 | #143 | Excellent 20.1% |
| Iranians | 84.0 /100 | #144 | Excellent 20.1% |
| Palestinians | 83.9 /100 | #145 | Excellent 20.1% |
Demographics Similar to Ghanaians by 3 or more Vehicles in Household
In terms of 3 or more vehicles in household, the demographic groups most similar to Ghanaians are Immigrants from Morocco (16.3%, a difference of 0.26%), Immigrants from Serbia (16.4%, a difference of 0.47%), Immigrants from Greece (16.5%, a difference of 0.78%), Somali (16.2%, a difference of 1.1%), and Paraguayan (16.6%, a difference of 1.2%).
| Demographics | Rating | Rank | 3 or more Vehicles in Household |
| Israelis | 0.1 /100 | #297 | Tragic 16.8% |
| Immigrants | Zaire | 0.1 /100 | #298 | Tragic 16.7% |
| Immigrants | South America | 0.1 /100 | #299 | Tragic 16.7% |
| Cypriots | 0.0 /100 | #300 | Tragic 16.6% |
| Paraguayans | 0.0 /100 | #301 | Tragic 16.6% |
| Immigrants | Greece | 0.0 /100 | #302 | Tragic 16.5% |
| Immigrants | Serbia | 0.0 /100 | #303 | Tragic 16.4% |
| Ghanaians | 0.0 /100 | #304 | Tragic 16.4% |
| Immigrants | Morocco | 0.0 /100 | #305 | Tragic 16.3% |
| Somalis | 0.0 /100 | #306 | Tragic 16.2% |
| Immigrants | Ghana | 0.0 /100 | #307 | Tragic 16.2% |
| Houma | 0.0 /100 | #308 | Tragic 16.1% |
| Immigrants | Somalia | 0.0 /100 | #309 | Tragic 15.9% |
| Moroccans | 0.0 /100 | #310 | Tragic 15.9% |
| Albanians | 0.0 /100 | #311 | Tragic 15.8% |