Albanian vs Immigrants from Kuwait 6th Grade
COMPARE
Albanian
Immigrants from Kuwait
6th Grade
6th Grade Comparison
Albanians
Immigrants from Kuwait
97.1%
6TH GRADE
57.8/ 100
METRIC RATING
163rd/ 347
METRIC RANK
97.3%
6TH GRADE
89.5/ 100
METRIC RATING
134th/ 347
METRIC RANK
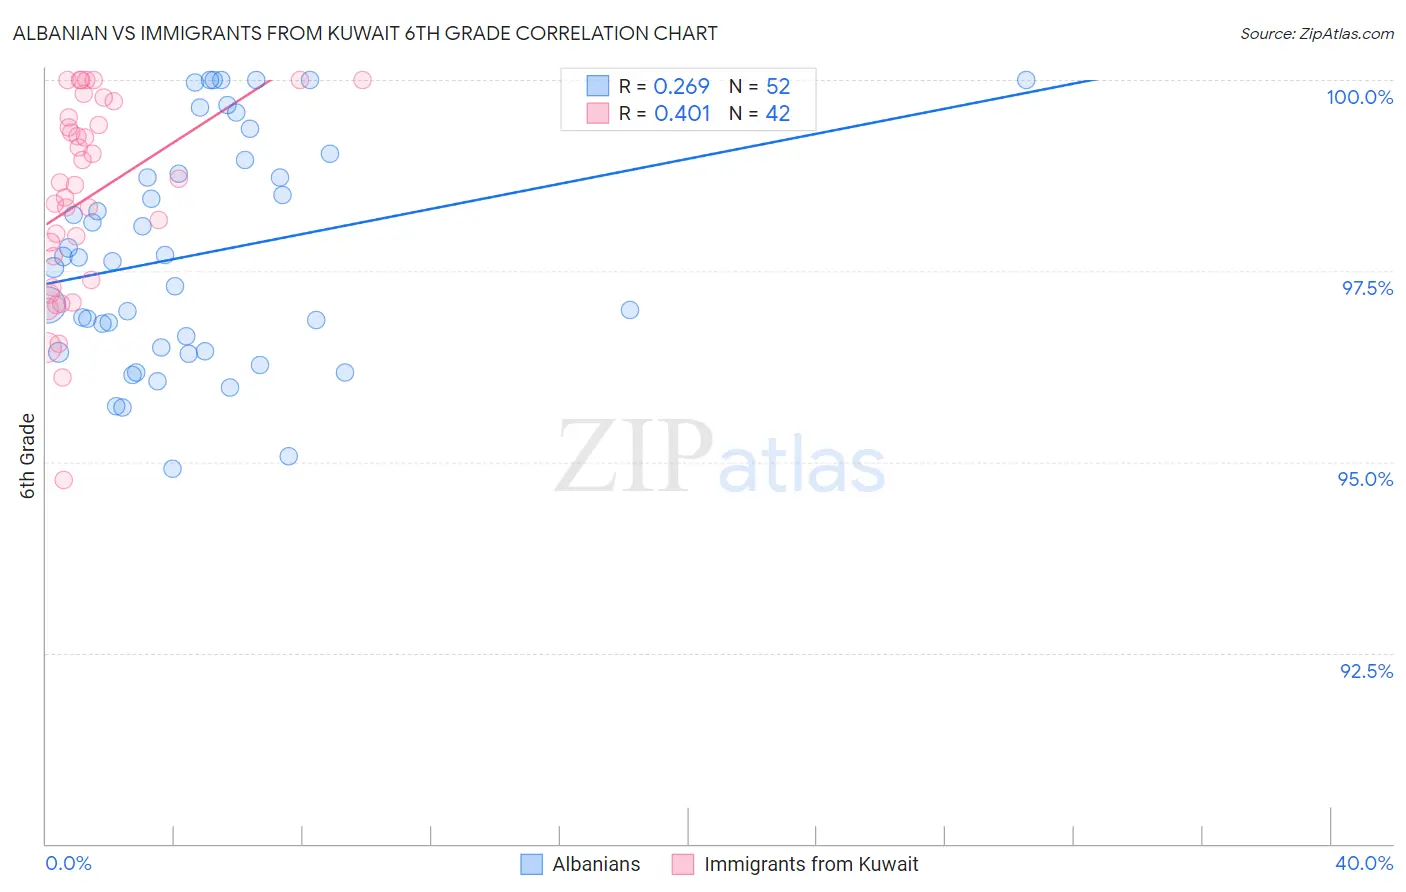
Albanian vs Immigrants from Kuwait 6th Grade Correlation Chart
The statistical analysis conducted on geographies consisting of 193,265,850 people shows a weak positive correlation between the proportion of Albanians and percentage of population with at least 6th grade education in the United States with a correlation coefficient (R) of 0.269 and weighted average of 97.1%. Similarly, the statistical analysis conducted on geographies consisting of 136,913,666 people shows a moderate positive correlation between the proportion of Immigrants from Kuwait and percentage of population with at least 6th grade education in the United States with a correlation coefficient (R) of 0.401 and weighted average of 97.3%, a difference of 0.21%.
6th Grade Correlation Summary
| Measurement | Albanian | Immigrants from Kuwait |
| Minimum | 94.9% | 94.8% |
| Maximum | 100.0% | 100.0% |
| Range | 5.1% | 5.2% |
| Mean | 97.7% | 98.5% |
| Median | 97.7% | 98.6% |
| Interquartile 25% (IQ1) | 96.5% | 97.4% |
| Interquartile 75% (IQ3) | 98.9% | 99.5% |
| Interquartile Range (IQR) | 2.4% | 2.1% |
| Standard Deviation (Sample) | 1.5% | 1.3% |
| Standard Deviation (Population) | 1.5% | 1.3% |
Similar Demographics by 6th Grade
Demographics Similar to Albanians by 6th Grade
In terms of 6th grade, the demographic groups most similar to Albanians are Immigrants from Korea (97.1%, a difference of 0.0%), Immigrants from Belarus (97.1%, a difference of 0.010%), Marshallese (97.1%, a difference of 0.010%), Immigrants from Poland (97.1%, a difference of 0.010%), and Kenyan (97.1%, a difference of 0.020%).
| Demographics | Rating | Rank | 6th Grade |
| Alsatians | 69.8 /100 | #156 | Good 97.1% |
| Immigrants | Russia | 67.6 /100 | #157 | Good 97.1% |
| Immigrants | Iran | 63.3 /100 | #158 | Good 97.1% |
| Kenyans | 62.9 /100 | #159 | Good 97.1% |
| Ugandans | 62.2 /100 | #160 | Good 97.1% |
| Immigrants | Belarus | 60.4 /100 | #161 | Good 97.1% |
| Marshallese | 60.2 /100 | #162 | Good 97.1% |
| Albanians | 57.8 /100 | #163 | Average 97.1% |
| Immigrants | Korea | 57.7 /100 | #164 | Average 97.1% |
| Immigrants | Poland | 56.2 /100 | #165 | Average 97.1% |
| Immigrants | Italy | 53.8 /100 | #166 | Average 97.1% |
| Apache | 53.6 /100 | #167 | Average 97.1% |
| Immigrants | Taiwan | 53.5 /100 | #168 | Average 97.1% |
| Bermudans | 52.6 /100 | #169 | Average 97.1% |
| Chileans | 52.1 /100 | #170 | Average 97.1% |
Demographics Similar to Immigrants from Kuwait by 6th Grade
In terms of 6th grade, the demographic groups most similar to Immigrants from Kuwait are Immigrants from Hungary (97.3%, a difference of 0.0%), Immigrants from Moldova (97.3%, a difference of 0.010%), Filipino (97.3%, a difference of 0.010%), Immigrants from Europe (97.3%, a difference of 0.020%), and Palestinian (97.3%, a difference of 0.020%).
| Demographics | Rating | Rank | 6th Grade |
| Immigrants | Croatia | 93.1 /100 | #127 | Exceptional 97.3% |
| Immigrants | Romania | 92.0 /100 | #128 | Exceptional 97.3% |
| Immigrants | Serbia | 91.9 /100 | #129 | Exceptional 97.3% |
| Cambodians | 91.8 /100 | #130 | Exceptional 97.3% |
| Immigrants | Europe | 91.1 /100 | #131 | Exceptional 97.3% |
| Palestinians | 90.9 /100 | #132 | Exceptional 97.3% |
| Immigrants | Moldova | 90.0 /100 | #133 | Excellent 97.3% |
| Immigrants | Kuwait | 89.5 /100 | #134 | Excellent 97.3% |
| Immigrants | Hungary | 89.5 /100 | #135 | Excellent 97.3% |
| Filipinos | 88.9 /100 | #136 | Excellent 97.3% |
| Burmese | 87.8 /100 | #137 | Excellent 97.3% |
| Blackfeet | 87.7 /100 | #138 | Excellent 97.3% |
| Immigrants | Turkey | 86.1 /100 | #139 | Excellent 97.3% |
| Immigrants | North Macedonia | 85.5 /100 | #140 | Excellent 97.2% |
| Seminole | 84.8 /100 | #141 | Excellent 97.2% |