Bermudan vs Croatian 4 or more Vehicles in Household
COMPARE
Bermudan
Croatian
4 or more Vehicles in Household
4 or more Vehicles in Household Comparison
Bermudans
Croatians
5.6%
4 OR MORE VEHICLES IN HOUSEHOLD
1.2/ 100
METRIC RATING
262nd/ 347
METRIC RANK
6.5%
4 OR MORE VEHICLES IN HOUSEHOLD
77.8/ 100
METRIC RATING
145th/ 347
METRIC RANK
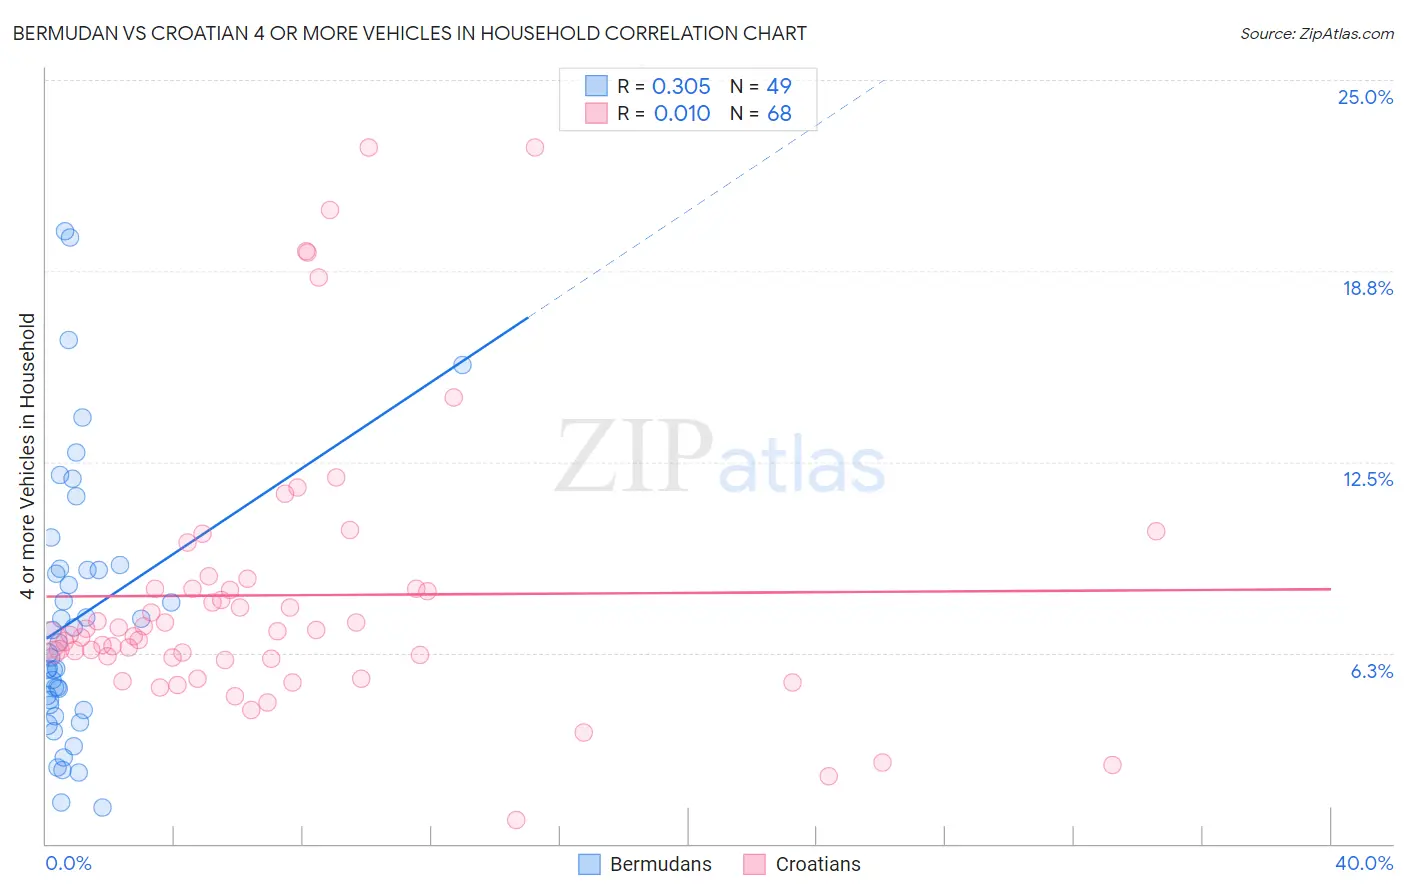
Bermudan vs Croatian 4 or more Vehicles in Household Correlation Chart
The statistical analysis conducted on geographies consisting of 55,665,642 people shows a mild positive correlation between the proportion of Bermudans and percentage of households with 4 or more vehicles available in the United States with a correlation coefficient (R) of 0.305 and weighted average of 5.6%. Similarly, the statistical analysis conducted on geographies consisting of 374,283,631 people shows no correlation between the proportion of Croatians and percentage of households with 4 or more vehicles available in the United States with a correlation coefficient (R) of 0.010 and weighted average of 6.5%, a difference of 16.2%.
4 or more Vehicles in Household Correlation Summary
| Measurement | Bermudan | Croatian |
| Minimum | 1.2% | 0.78% |
| Maximum | 20.0% | 22.8% |
| Range | 18.9% | 22.0% |
| Mean | 7.4% | 8.1% |
| Median | 6.2% | 6.9% |
| Interquartile 25% (IQ1) | 4.5% | 6.1% |
| Interquartile 75% (IQ3) | 9.0% | 8.3% |
| Interquartile Range (IQR) | 4.5% | 2.3% |
| Standard Deviation (Sample) | 4.4% | 4.5% |
| Standard Deviation (Population) | 4.3% | 4.5% |
Similar Demographics by 4 or more Vehicles in Household
Demographics Similar to Bermudans by 4 or more Vehicles in Household
In terms of 4 or more vehicles in household, the demographic groups most similar to Bermudans are Immigrants from Saudi Arabia (5.6%, a difference of 0.090%), Sudanese (5.6%, a difference of 0.11%), Uruguayan (5.6%, a difference of 0.20%), Immigrants from France (5.6%, a difference of 0.38%), and Immigrants from Lithuania (5.6%, a difference of 0.42%).
| Demographics | Rating | Rank | 4 or more Vehicles in Household |
| Yup'ik | 1.5 /100 | #255 | Tragic 5.7% |
| Immigrants | Turkey | 1.5 /100 | #256 | Tragic 5.7% |
| Immigrants | Northern Africa | 1.4 /100 | #257 | Tragic 5.6% |
| Immigrants | Lithuania | 1.4 /100 | #258 | Tragic 5.6% |
| Immigrants | France | 1.3 /100 | #259 | Tragic 5.6% |
| Uruguayans | 1.3 /100 | #260 | Tragic 5.6% |
| Sudanese | 1.2 /100 | #261 | Tragic 5.6% |
| Bermudans | 1.2 /100 | #262 | Tragic 5.6% |
| Immigrants | Saudi Arabia | 1.1 /100 | #263 | Tragic 5.6% |
| Immigrants | Africa | 1.0 /100 | #264 | Tragic 5.6% |
| South Americans | 0.9 /100 | #265 | Tragic 5.6% |
| Immigrants | Nepal | 0.9 /100 | #266 | Tragic 5.6% |
| Immigrants | Ukraine | 0.9 /100 | #267 | Tragic 5.6% |
| Colombians | 0.7 /100 | #268 | Tragic 5.5% |
| Carpatho Rusyns | 0.7 /100 | #269 | Tragic 5.5% |
Demographics Similar to Croatians by 4 or more Vehicles in Household
In terms of 4 or more vehicles in household, the demographic groups most similar to Croatians are Immigrants from North America (6.5%, a difference of 0.10%), Immigrants from Canada (6.5%, a difference of 0.11%), Immigrants from Iraq (6.5%, a difference of 0.25%), Australian (6.6%, a difference of 0.45%), and Immigrants from Costa Rica (6.5%, a difference of 0.46%).
| Demographics | Rating | Rank | 4 or more Vehicles in Household |
| Italians | 84.5 /100 | #138 | Excellent 6.6% |
| Jordanians | 82.1 /100 | #139 | Excellent 6.6% |
| Slavs | 81.6 /100 | #140 | Excellent 6.6% |
| Australians | 80.8 /100 | #141 | Excellent 6.6% |
| Immigrants | Iraq | 79.4 /100 | #142 | Good 6.5% |
| Immigrants | Canada | 78.6 /100 | #143 | Good 6.5% |
| Immigrants | North America | 78.5 /100 | #144 | Good 6.5% |
| Croatians | 77.8 /100 | #145 | Good 6.5% |
| Immigrants | Costa Rica | 74.4 /100 | #146 | Good 6.5% |
| Immigrants | Iran | 73.9 /100 | #147 | Good 6.5% |
| Immigrants | Jordan | 73.7 /100 | #148 | Good 6.5% |
| Greeks | 73.6 /100 | #149 | Good 6.5% |
| New Zealanders | 73.3 /100 | #150 | Good 6.5% |
| Immigrants | Hong Kong | 72.2 /100 | #151 | Good 6.5% |
| Yuman | 72.1 /100 | #152 | Good 6.5% |