Immigrants from Cambodia vs Croatian 4 or more Vehicles in Household
COMPARE
Immigrants from Cambodia
Croatian
4 or more Vehicles in Household
4 or more Vehicles in Household Comparison
Immigrants from Cambodia
Croatians
7.4%
4 OR MORE VEHICLES IN HOUSEHOLD
99.9/ 100
METRIC RATING
75th/ 347
METRIC RANK
6.5%
4 OR MORE VEHICLES IN HOUSEHOLD
77.8/ 100
METRIC RATING
145th/ 347
METRIC RANK
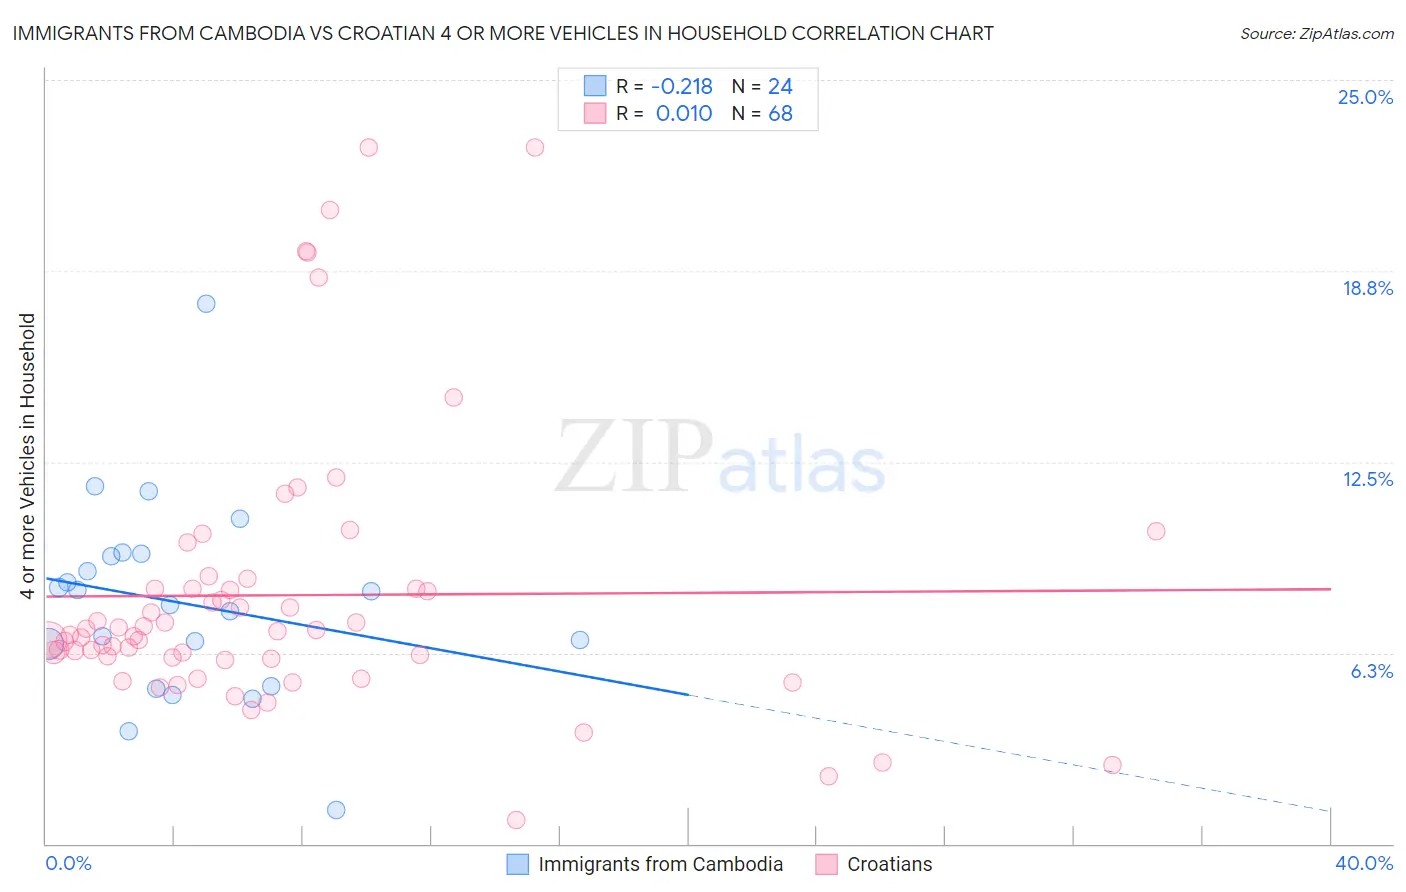
Immigrants from Cambodia vs Croatian 4 or more Vehicles in Household Correlation Chart
The statistical analysis conducted on geographies consisting of 205,078,675 people shows a weak negative correlation between the proportion of Immigrants from Cambodia and percentage of households with 4 or more vehicles available in the United States with a correlation coefficient (R) of -0.218 and weighted average of 7.4%. Similarly, the statistical analysis conducted on geographies consisting of 374,283,631 people shows no correlation between the proportion of Croatians and percentage of households with 4 or more vehicles available in the United States with a correlation coefficient (R) of 0.010 and weighted average of 6.5%, a difference of 13.2%.
4 or more Vehicles in Household Correlation Summary
| Measurement | Immigrants from Cambodia | Croatian |
| Minimum | 1.1% | 0.78% |
| Maximum | 17.7% | 22.8% |
| Range | 16.6% | 22.0% |
| Mean | 7.9% | 8.1% |
| Median | 8.0% | 6.9% |
| Interquartile 25% (IQ1) | 5.9% | 6.1% |
| Interquartile 75% (IQ3) | 9.4% | 8.3% |
| Interquartile Range (IQR) | 3.6% | 2.3% |
| Standard Deviation (Sample) | 3.3% | 4.5% |
| Standard Deviation (Population) | 3.2% | 4.5% |
Similar Demographics by 4 or more Vehicles in Household
Demographics Similar to Immigrants from Cambodia by 4 or more Vehicles in Household
In terms of 4 or more vehicles in household, the demographic groups most similar to Immigrants from Cambodia are Icelander (7.4%, a difference of 0.0%), Laotian (7.4%, a difference of 0.050%), Apache (7.4%, a difference of 0.22%), White/Caucasian (7.4%, a difference of 0.28%), and Portuguese (7.4%, a difference of 0.31%).
| Demographics | Rating | Rank | 4 or more Vehicles in Household |
| Welsh | 99.9 /100 | #68 | Exceptional 7.5% |
| Germans | 99.9 /100 | #69 | Exceptional 7.5% |
| Scottish | 99.9 /100 | #70 | Exceptional 7.4% |
| Chickasaw | 99.9 /100 | #71 | Exceptional 7.4% |
| Scotch-Irish | 99.9 /100 | #72 | Exceptional 7.4% |
| Portuguese | 99.9 /100 | #73 | Exceptional 7.4% |
| Icelanders | 99.9 /100 | #74 | Exceptional 7.4% |
| Immigrants | Cambodia | 99.9 /100 | #75 | Exceptional 7.4% |
| Laotians | 99.9 /100 | #76 | Exceptional 7.4% |
| Apache | 99.9 /100 | #77 | Exceptional 7.4% |
| Whites/Caucasians | 99.8 /100 | #78 | Exceptional 7.4% |
| Czechs | 99.8 /100 | #79 | Exceptional 7.4% |
| Alaska Natives | 99.8 /100 | #80 | Exceptional 7.3% |
| Finns | 99.8 /100 | #81 | Exceptional 7.3% |
| Northern Europeans | 99.8 /100 | #82 | Exceptional 7.3% |
Demographics Similar to Croatians by 4 or more Vehicles in Household
In terms of 4 or more vehicles in household, the demographic groups most similar to Croatians are Immigrants from North America (6.5%, a difference of 0.10%), Immigrants from Canada (6.5%, a difference of 0.11%), Immigrants from Iraq (6.5%, a difference of 0.25%), Australian (6.6%, a difference of 0.45%), and Immigrants from Costa Rica (6.5%, a difference of 0.46%).
| Demographics | Rating | Rank | 4 or more Vehicles in Household |
| Italians | 84.5 /100 | #138 | Excellent 6.6% |
| Jordanians | 82.1 /100 | #139 | Excellent 6.6% |
| Slavs | 81.6 /100 | #140 | Excellent 6.6% |
| Australians | 80.8 /100 | #141 | Excellent 6.6% |
| Immigrants | Iraq | 79.4 /100 | #142 | Good 6.5% |
| Immigrants | Canada | 78.6 /100 | #143 | Good 6.5% |
| Immigrants | North America | 78.5 /100 | #144 | Good 6.5% |
| Croatians | 77.8 /100 | #145 | Good 6.5% |
| Immigrants | Costa Rica | 74.4 /100 | #146 | Good 6.5% |
| Immigrants | Iran | 73.9 /100 | #147 | Good 6.5% |
| Immigrants | Jordan | 73.7 /100 | #148 | Good 6.5% |
| Greeks | 73.6 /100 | #149 | Good 6.5% |
| New Zealanders | 73.3 /100 | #150 | Good 6.5% |
| Immigrants | Hong Kong | 72.2 /100 | #151 | Good 6.5% |
| Yuman | 72.1 /100 | #152 | Good 6.5% |