Immigrants from Nicaragua vs Immigrants from India 4 or more Vehicles in Household
COMPARE
Immigrants from Nicaragua
Immigrants from India
4 or more Vehicles in Household
4 or more Vehicles in Household Comparison
Immigrants from Nicaragua
Immigrants from India
6.8%
4 OR MORE VEHICLES IN HOUSEHOLD
94.7/ 100
METRIC RATING
122nd/ 347
METRIC RANK
6.3%
4 OR MORE VEHICLES IN HOUSEHOLD
51.9/ 100
METRIC RATING
171st/ 347
METRIC RANK
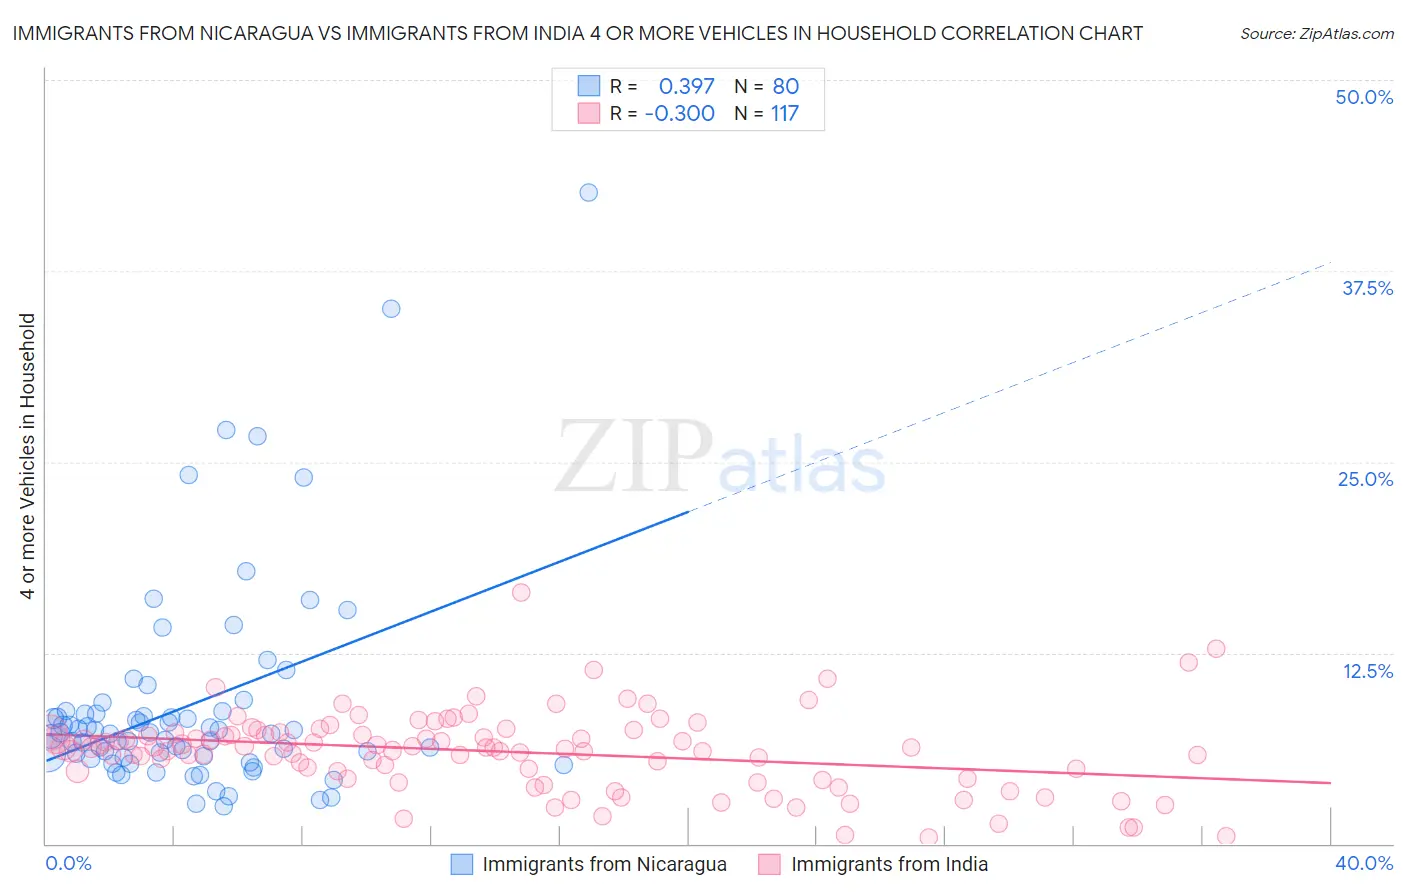
Immigrants from Nicaragua vs Immigrants from India 4 or more Vehicles in Household Correlation Chart
The statistical analysis conducted on geographies consisting of 235,613,806 people shows a mild positive correlation between the proportion of Immigrants from Nicaragua and percentage of households with 4 or more vehicles available in the United States with a correlation coefficient (R) of 0.397 and weighted average of 6.8%. Similarly, the statistical analysis conducted on geographies consisting of 431,878,521 people shows a mild negative correlation between the proportion of Immigrants from India and percentage of households with 4 or more vehicles available in the United States with a correlation coefficient (R) of -0.300 and weighted average of 6.3%, a difference of 7.1%.
4 or more Vehicles in Household Correlation Summary
| Measurement | Immigrants from Nicaragua | Immigrants from India |
| Minimum | 2.4% | 0.38% |
| Maximum | 42.6% | 16.5% |
| Range | 40.2% | 16.1% |
| Mean | 9.1% | 6.0% |
| Median | 7.2% | 6.3% |
| Interquartile 25% (IQ1) | 5.7% | 4.5% |
| Interquartile 75% (IQ3) | 8.6% | 7.2% |
| Interquartile Range (IQR) | 2.9% | 2.8% |
| Standard Deviation (Sample) | 7.0% | 2.6% |
| Standard Deviation (Population) | 6.9% | 2.6% |
Similar Demographics by 4 or more Vehicles in Household
Demographics Similar to Immigrants from Nicaragua by 4 or more Vehicles in Household
In terms of 4 or more vehicles in household, the demographic groups most similar to Immigrants from Nicaragua are Immigrants from Germany (6.8%, a difference of 0.0%), Comanche (6.8%, a difference of 0.060%), Immigrants (6.8%, a difference of 0.060%), Immigrants from Asia (6.8%, a difference of 0.16%), and Austrian (6.8%, a difference of 0.26%).
| Demographics | Rating | Rank | 4 or more Vehicles in Household |
| Tlingit-Haida | 96.2 /100 | #115 | Exceptional 6.8% |
| Immigrants | Guatemala | 95.8 /100 | #116 | Exceptional 6.8% |
| Burmese | 95.7 /100 | #117 | Exceptional 6.8% |
| French American Indians | 95.7 /100 | #118 | Exceptional 6.8% |
| Costa Ricans | 95.5 /100 | #119 | Exceptional 6.8% |
| Comanche | 94.8 /100 | #120 | Exceptional 6.8% |
| Immigrants | Germany | 94.7 /100 | #121 | Exceptional 6.8% |
| Immigrants | Nicaragua | 94.7 /100 | #122 | Exceptional 6.8% |
| Immigrants | Immigrants | 94.6 /100 | #123 | Exceptional 6.8% |
| Immigrants | Asia | 94.4 /100 | #124 | Exceptional 6.8% |
| Austrians | 94.1 /100 | #125 | Exceptional 6.8% |
| Belgians | 94.1 /100 | #126 | Exceptional 6.8% |
| Immigrants | Korea | 93.8 /100 | #127 | Exceptional 6.8% |
| Immigrants | Bolivia | 92.5 /100 | #128 | Exceptional 6.7% |
| Immigrants | England | 92.0 /100 | #129 | Exceptional 6.7% |
Demographics Similar to Immigrants from India by 4 or more Vehicles in Household
In terms of 4 or more vehicles in household, the demographic groups most similar to Immigrants from India are Immigrants from Lebanon (6.3%, a difference of 0.020%), Immigrants from Syria (6.3%, a difference of 0.080%), Slovene (6.3%, a difference of 0.080%), Lithuanian (6.3%, a difference of 0.20%), and Estonian (6.4%, a difference of 0.32%).
| Demographics | Rating | Rank | 4 or more Vehicles in Household |
| Hungarians | 61.1 /100 | #164 | Good 6.4% |
| Immigrants | Peru | 59.8 /100 | #165 | Average 6.4% |
| Immigrants | Denmark | 57.8 /100 | #166 | Average 6.4% |
| Poles | 56.9 /100 | #167 | Average 6.4% |
| Lebanese | 55.8 /100 | #168 | Average 6.4% |
| Estonians | 55.1 /100 | #169 | Average 6.4% |
| Immigrants | Syria | 52.8 /100 | #170 | Average 6.3% |
| Immigrants | India | 51.9 /100 | #171 | Average 6.3% |
| Immigrants | Lebanon | 51.7 /100 | #172 | Average 6.3% |
| Slovenes | 51.1 /100 | #173 | Average 6.3% |
| Lithuanians | 50.0 /100 | #174 | Average 6.3% |
| Immigrants | Western Europe | 48.8 /100 | #175 | Average 6.3% |
| Ukrainians | 47.6 /100 | #176 | Average 6.3% |
| Slovaks | 46.9 /100 | #177 | Average 6.3% |
| Belizeans | 44.5 /100 | #178 | Average 6.3% |