African vs Bhutanese Female Poverty Among 25-34 Year Olds
COMPARE
African
Bhutanese
Female Poverty Among 25-34 Year Olds
Female Poverty Among 25-34 Year Olds Comparison
Africans
Bhutanese
17.0%
FEMALE POVERTY AMONG 25-34 YEAR OLDS
0.0/ 100
METRIC RATING
308th/ 347
METRIC RANK
11.4%
FEMALE POVERTY AMONG 25-34 YEAR OLDS
99.9/ 100
METRIC RATING
25th/ 347
METRIC RANK
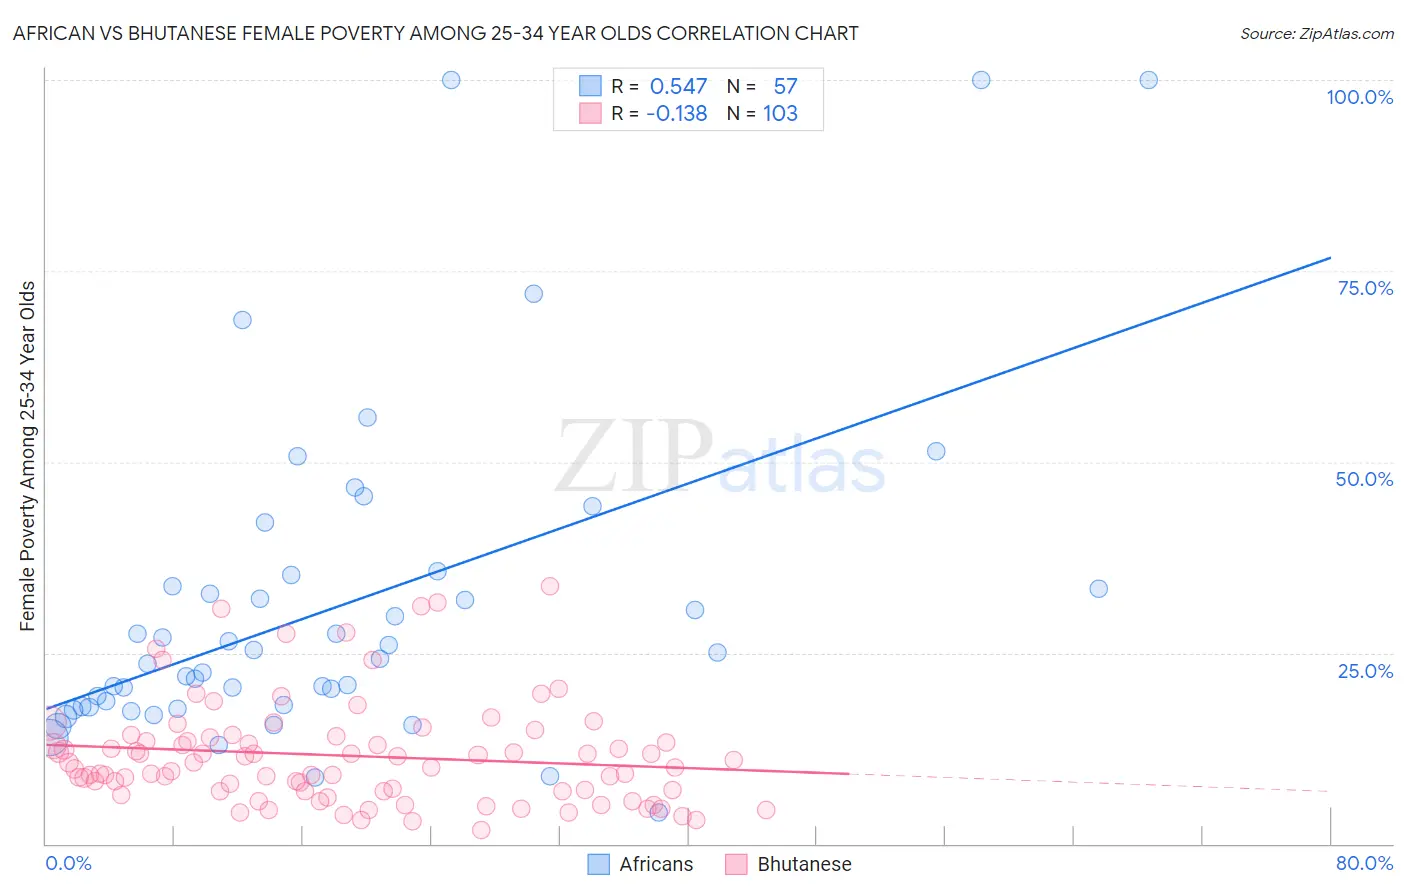
African vs Bhutanese Female Poverty Among 25-34 Year Olds Correlation Chart
The statistical analysis conducted on geographies consisting of 463,188,909 people shows a substantial positive correlation between the proportion of Africans and poverty level among females between the ages 25 and 34 in the United States with a correlation coefficient (R) of 0.547 and weighted average of 17.0%. Similarly, the statistical analysis conducted on geographies consisting of 446,147,907 people shows a poor negative correlation between the proportion of Bhutanese and poverty level among females between the ages 25 and 34 in the United States with a correlation coefficient (R) of -0.138 and weighted average of 11.4%, a difference of 48.9%.
Female Poverty Among 25-34 Year Olds Correlation Summary
| Measurement | African | Bhutanese |
| Minimum | 4.1% | 1.8% |
| Maximum | 100.0% | 33.8% |
| Range | 95.9% | 31.9% |
| Mean | 31.0% | 11.5% |
| Median | 24.2% | 9.9% |
| Interquartile 25% (IQ1) | 17.9% | 6.9% |
| Interquartile 75% (IQ3) | 34.5% | 13.9% |
| Interquartile Range (IQR) | 16.5% | 7.0% |
| Standard Deviation (Sample) | 21.4% | 6.8% |
| Standard Deviation (Population) | 21.2% | 6.7% |
Similar Demographics by Female Poverty Among 25-34 Year Olds
Demographics Similar to Africans by Female Poverty Among 25-34 Year Olds
In terms of female poverty among 25-34 year olds, the demographic groups most similar to Africans are Yaqui (17.0%, a difference of 0.20%), Chickasaw (17.0%, a difference of 0.22%), Ottawa (17.1%, a difference of 0.30%), Cherokee (17.2%, a difference of 0.77%), and Immigrants from Cabo Verde (16.9%, a difference of 0.80%).
| Demographics | Rating | Rank | Female Poverty Among 25-34 Year Olds |
| Immigrants | Congo | 0.0 /100 | #301 | Tragic 16.7% |
| Alaska Natives | 0.0 /100 | #302 | Tragic 16.8% |
| Immigrants | Mexico | 0.0 /100 | #303 | Tragic 16.8% |
| Hondurans | 0.0 /100 | #304 | Tragic 16.9% |
| Immigrants | Cabo Verde | 0.0 /100 | #305 | Tragic 16.9% |
| Chickasaw | 0.0 /100 | #306 | Tragic 17.0% |
| Yaqui | 0.0 /100 | #307 | Tragic 17.0% |
| Africans | 0.0 /100 | #308 | Tragic 17.0% |
| Ottawa | 0.0 /100 | #309 | Tragic 17.1% |
| Cherokee | 0.0 /100 | #310 | Tragic 17.2% |
| Immigrants | Honduras | 0.0 /100 | #311 | Tragic 17.3% |
| Iroquois | 0.0 /100 | #312 | Tragic 17.5% |
| Colville | 0.0 /100 | #313 | Tragic 17.5% |
| Immigrants | Dominican Republic | 0.0 /100 | #314 | Tragic 17.6% |
| Yakama | 0.0 /100 | #315 | Tragic 17.6% |
Demographics Similar to Bhutanese by Female Poverty Among 25-34 Year Olds
In terms of female poverty among 25-34 year olds, the demographic groups most similar to Bhutanese are Tongan (11.5%, a difference of 0.15%), Maltese (11.4%, a difference of 0.22%), Bolivian (11.4%, a difference of 0.25%), Asian (11.4%, a difference of 0.31%), and Immigrants from Greece (11.5%, a difference of 0.45%).
| Demographics | Rating | Rank | Female Poverty Among 25-34 Year Olds |
| Immigrants | Eastern Asia | 100.0 /100 | #18 | Exceptional 11.2% |
| Iranians | 100.0 /100 | #19 | Exceptional 11.2% |
| Okinawans | 100.0 /100 | #20 | Exceptional 11.3% |
| Turks | 100.0 /100 | #21 | Exceptional 11.4% |
| Asians | 99.9 /100 | #22 | Exceptional 11.4% |
| Bolivians | 99.9 /100 | #23 | Exceptional 11.4% |
| Maltese | 99.9 /100 | #24 | Exceptional 11.4% |
| Bhutanese | 99.9 /100 | #25 | Exceptional 11.4% |
| Tongans | 99.9 /100 | #26 | Exceptional 11.5% |
| Immigrants | Greece | 99.9 /100 | #27 | Exceptional 11.5% |
| Immigrants | Pakistan | 99.9 /100 | #28 | Exceptional 11.5% |
| Bulgarians | 99.9 /100 | #29 | Exceptional 11.5% |
| Cypriots | 99.9 /100 | #30 | Exceptional 11.5% |
| Immigrants | Japan | 99.9 /100 | #31 | Exceptional 11.6% |
| Immigrants | Asia | 99.9 /100 | #32 | Exceptional 11.6% |