Afghan vs Subsaharan African Master's Degree
COMPARE
Afghan
Subsaharan African
Master's Degree
Master's Degree Comparison
Afghans
Sub-Saharan Africans
16.5%
MASTER'S DEGREE
96.2/ 100
METRIC RATING
121st/ 347
METRIC RANK
14.2%
MASTER'S DEGREE
19.4/ 100
METRIC RATING
210th/ 347
METRIC RANK
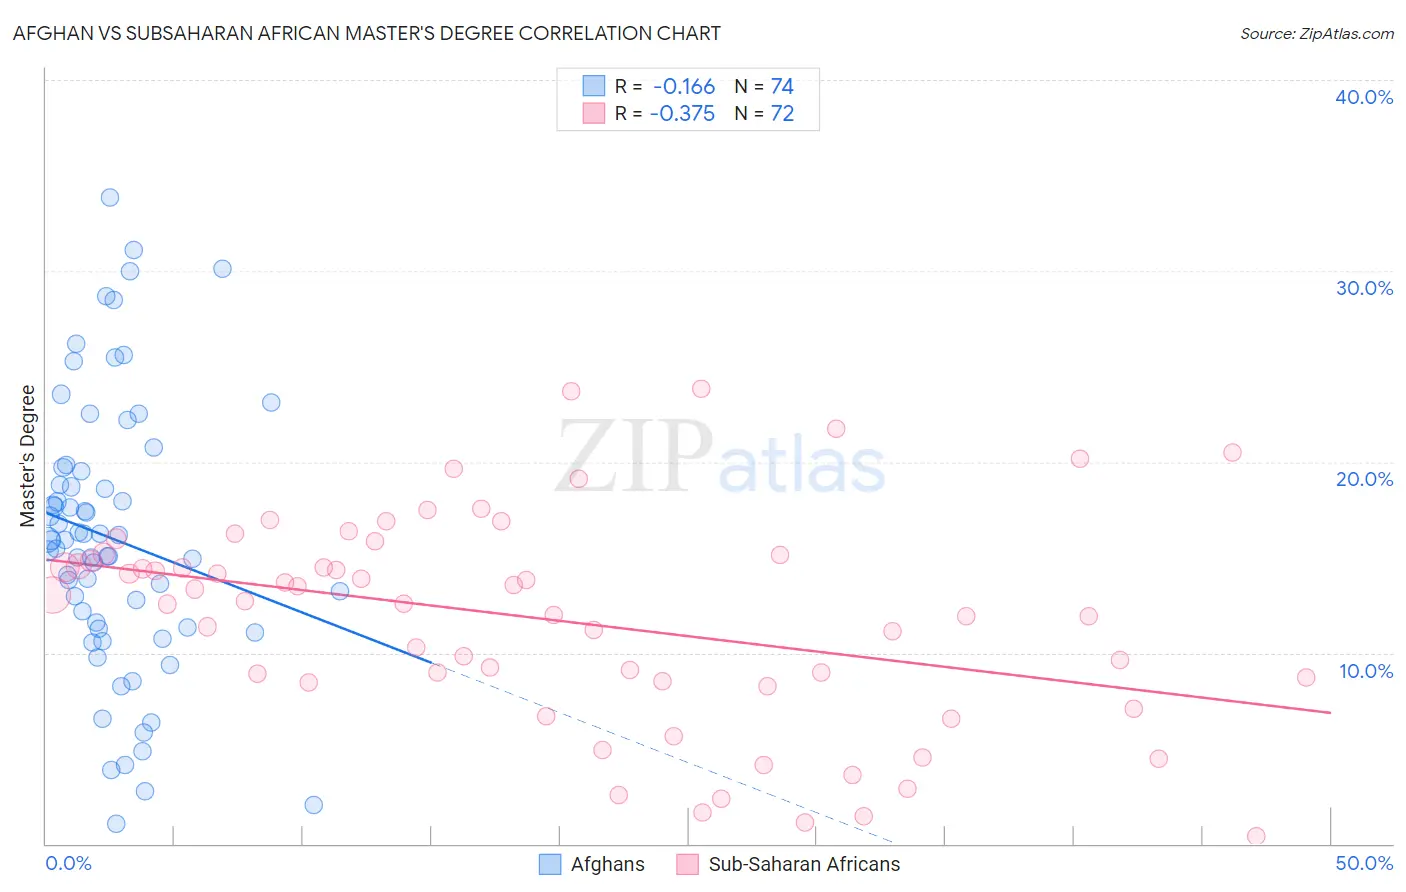
Afghan vs Subsaharan African Master's Degree Correlation Chart
The statistical analysis conducted on geographies consisting of 148,857,027 people shows a poor negative correlation between the proportion of Afghans and percentage of population with at least master's degree education in the United States with a correlation coefficient (R) of -0.166 and weighted average of 16.5%. Similarly, the statistical analysis conducted on geographies consisting of 507,799,388 people shows a mild negative correlation between the proportion of Sub-Saharan Africans and percentage of population with at least master's degree education in the United States with a correlation coefficient (R) of -0.375 and weighted average of 14.2%, a difference of 15.6%.
Master's Degree Correlation Summary
| Measurement | Afghan | Subsaharan African |
| Minimum | 1.0% | 0.40% |
| Maximum | 33.8% | 23.9% |
| Range | 32.8% | 23.5% |
| Mean | 16.0% | 11.7% |
| Median | 15.9% | 12.6% |
| Interquartile 25% (IQ1) | 11.3% | 8.5% |
| Interquartile 75% (IQ3) | 19.5% | 15.0% |
| Interquartile Range (IQR) | 8.2% | 6.5% |
| Standard Deviation (Sample) | 7.1% | 5.5% |
| Standard Deviation (Population) | 7.1% | 5.5% |
Similar Demographics by Master's Degree
Demographics Similar to Afghans by Master's Degree
In terms of master's degree, the demographic groups most similar to Afghans are Lebanese (16.5%, a difference of 0.20%), Jordanian (16.5%, a difference of 0.30%), British (16.4%, a difference of 0.43%), Croatian (16.4%, a difference of 0.44%), and Immigrants from Eritrea (16.4%, a difference of 0.52%).
| Demographics | Rating | Rank | Master's Degree |
| Northern Europeans | 97.6 /100 | #114 | Exceptional 16.7% |
| Immigrants | Uganda | 97.3 /100 | #115 | Exceptional 16.6% |
| Immigrants | Southern Europe | 97.2 /100 | #116 | Exceptional 16.6% |
| Immigrants | Moldova | 97.2 /100 | #117 | Exceptional 16.6% |
| Brazilians | 96.8 /100 | #118 | Exceptional 16.5% |
| Jordanians | 96.5 /100 | #119 | Exceptional 16.5% |
| Lebanese | 96.4 /100 | #120 | Exceptional 16.5% |
| Afghans | 96.2 /100 | #121 | Exceptional 16.5% |
| British | 95.6 /100 | #122 | Exceptional 16.4% |
| Croatians | 95.6 /100 | #123 | Exceptional 16.4% |
| Immigrants | Eritrea | 95.5 /100 | #124 | Exceptional 16.4% |
| Italians | 95.4 /100 | #125 | Exceptional 16.4% |
| Immigrants | Eastern Africa | 95.2 /100 | #126 | Exceptional 16.3% |
| Palestinians | 94.8 /100 | #127 | Exceptional 16.3% |
| Immigrants | Sierra Leone | 94.7 /100 | #128 | Exceptional 16.3% |
Demographics Similar to Sub-Saharan Africans by Master's Degree
In terms of master's degree, the demographic groups most similar to Sub-Saharan Africans are Immigrants from Panama (14.3%, a difference of 0.13%), Immigrants from Barbados (14.3%, a difference of 0.22%), Somali (14.2%, a difference of 0.31%), Spanish (14.2%, a difference of 0.36%), and Immigrants from Bosnia and Herzegovina (14.3%, a difference of 0.52%).
| Demographics | Rating | Rank | Master's Degree |
| Yugoslavians | 24.3 /100 | #203 | Fair 14.4% |
| French | 23.7 /100 | #204 | Fair 14.4% |
| Trinidadians and Tobagonians | 23.5 /100 | #205 | Fair 14.4% |
| Scandinavians | 23.3 /100 | #206 | Fair 14.4% |
| Immigrants | Bosnia and Herzegovina | 22.0 /100 | #207 | Fair 14.3% |
| Immigrants | Barbados | 20.5 /100 | #208 | Fair 14.3% |
| Immigrants | Panama | 20.0 /100 | #209 | Fair 14.3% |
| Sub-Saharan Africans | 19.4 /100 | #210 | Poor 14.2% |
| Somalis | 18.0 /100 | #211 | Poor 14.2% |
| Spanish | 17.8 /100 | #212 | Poor 14.2% |
| Immigrants | Thailand | 17.0 /100 | #213 | Poor 14.2% |
| Finns | 16.9 /100 | #214 | Poor 14.2% |
| Immigrants | Vietnam | 16.1 /100 | #215 | Poor 14.1% |
| Immigrants | Somalia | 15.8 /100 | #216 | Poor 14.1% |
| Immigrants | Trinidad and Tobago | 15.8 /100 | #217 | Poor 14.1% |