Afghan vs Subsaharan African Child Poverty Under the Age of 16

COMPARE

Afghan
Race
Ancestry
AfghanAfricanAlaska NativeAlaskan AthabascanAlbanianAleutAlsatianAmericanApacheArabArapahoArgentineanArmenianAssyrian/Chaldean/SyriacAustralianAustrianBahamianBangladeshiBarbadianBasqueBelgianBelizeanBermudanBhutaneseBlackfeetBolivianBrazilianBritishBritish West IndianBulgarianBurmeseCajunCambodianCanadianCape VerdeanCarpatho RusynCelticCentral AmericanCentral American IndianCherokeeCheyenneChickasawChileanChineseChippewaChoctawColombianColvilleComancheCosta RicanCreeCreekCroatianCrowCubanCypriotCzechCzechoslovakianDanishDelawareDominicanDutchDutch West IndianEastern EuropeanEcuadorianEgyptianEnglishEstonianEthiopianEuropeanFijianFilipinoFinnishFrenchFrench American IndianFrench CanadianGermanGerman RussianGhanaianGreekGuamanian/ChamorroGuatemalanGuyaneseHaitianHmongHonduranHopiHoumaHungarianIcelanderIndian (Asian)IndonesianInupiatIranianIraqiIrishIroquoisIsraeliItalianJamaicanJapaneseJordanianKenyanKiowaKoreanLaotianLatvianLebaneseLiberianLithuanianLumbeeLuxembourgerMacedonianMalaysianMalteseMarshalleseMenomineeMexicanMexican American IndianMongolianMoroccanNative HawaiianNavajoNepaleseNew ZealanderNicaraguanNigerianNorthern EuropeanNorwegianOkinawanOsageOttawaPaiutePakistaniPalestinianPanamanianParaguayanPennsylvania GermanPeruvianPimaPolishPortuguesePotawatomiPuebloPuerto RicanPuget Sound SalishRomanianRussianSalvadoranSamoanScandinavianScotch-IrishScottishSeminoleSenegaleseSerbianShoshoneSierra LeoneanSiouxSlavicSlovakSloveneSomaliSouth AfricanSouth AmericanSouth American IndianSoviet UnionSpaniardSpanishSpanish AmericanSpanish American IndianSri LankanSudaneseSwedishSwissSyrianTaiwaneseThaiTlingit-HaidaTohono O'OdhamTonganTrinidadian and TobagonianTsimshianTurkishU.S. Virgin IslanderUgandanUkrainianUruguayanUteVenezuelanVietnameseWelshWest IndianYakamaYaquiYugoslavianYumanYup'ikZimbabwean
Immigration
NonimmigrantsImmigrantsAfghanistanAfricaAlbaniaArgentinaArmeniaAsiaAustraliaAustriaBahamasBangladeshBarbadosBelarusBelgiumBelizeBoliviaBosnia and HerzegovinaBrazilBulgariaBurma/MyanmarCabo VerdeCambodiaCameroonCanadaCaribbeanCentral AmericaChileChinaColombiaCongoCosta RicaCroatiaCubaCzechoslovakiaDenmarkDominicaDominican RepublicEastern AfricaEastern AsiaEastern EuropeEcuadorEgyptEl SalvadorEnglandEritreaEthiopiaEuropeFijiFranceGermanyGhanaGreeceGrenadaGuatemalaGuyanaHaitiHondurasHong KongHungaryIndiaIndonesiaIranIraqIrelandIsraelItalyJamaicaJapanJordanKazakhstanKenyaKoreaKuwaitLaosLatin AmericaLatviaLebanonLiberiaLithuaniaMalaysiaMexicoMicronesiaMiddle AfricaMoldovaMoroccoNepalNetherlandsNicaraguaNigeriaNorth AmericaNorth MacedoniaNorthern AfricaNorthern EuropeNorwayOceaniaPakistanPanamaPeruPhilippinesPolandPortugalRomaniaRussiaSaudi ArabiaScotlandSenegalSerbiaSierra LeoneSingaporeSomaliaSouth AfricaSouth AmericaSouth Central AsiaSouth Eastern AsiaSouthern EuropeSpainSri LankaSt. Vincent and the GrenadinesSudanSwedenSwitzerlandSyriaTaiwanThailandTrinidad and TobagoTurkeyUgandaUkraineUruguayUzbekistanVenezuelaVietnamWest IndiesWestern AfricaWestern AsiaWestern EuropeYemenZaireZimbabweAzores
Subsaharan African
Race
Ancestry
AfricanAlaska NativeAlaskan AthabascanAlbanianAleutAlsatianAmericanApacheArabArapahoArgentineanArmenianAssyrian/Chaldean/SyriacAustralianAustrianBahamianBangladeshiBarbadianBasqueBelgianBelizeanBermudanBhutaneseBlackfeetBolivianBrazilianBritishBritish West IndianBulgarianBurmeseCajunCambodianCanadianCape VerdeanCarpatho RusynCelticCentral AmericanCentral American IndianCherokeeCheyenneChickasawChileanChineseChippewaChoctawColombianColvilleComancheCosta RicanCreeCreekCroatianCrowCubanCypriotCzechCzechoslovakianDanishDelawareDominicanDutchDutch West IndianEastern EuropeanEcuadorianEgyptianEnglishEstonianEthiopianEuropeanFijianFilipinoFinnishFrenchFrench American IndianFrench CanadianGermanGerman RussianGhanaianGreekGuamanian/ChamorroGuatemalanGuyaneseHaitianHmongHonduranHopiHoumaHungarianIcelanderIndian (Asian)IndonesianInupiatIranianIraqiIrishIroquoisIsraeliItalianJamaicanJapaneseJordanianKenyanKiowaKoreanLaotianLatvianLebaneseLiberianLithuanianLumbeeLuxembourgerMacedonianMalaysianMalteseMarshalleseMenomineeMexicanMexican American IndianMongolianMoroccanNative HawaiianNavajoNepaleseNew ZealanderNicaraguanNigerianNorthern EuropeanNorwegianOkinawanOsageOttawaPaiutePakistaniPalestinianPanamanianParaguayanPennsylvania GermanPeruvianPimaPolishPortuguesePotawatomiPuebloPuerto RicanPuget Sound SalishRomanianRussianSalvadoranSamoanScandinavianScotch-IrishScottishSeminoleSenegaleseSerbianShoshoneSierra LeoneanSiouxSlavicSlovakSloveneSomaliSouth AfricanSouth AmericanSouth American IndianSoviet UnionSpaniardSpanishSpanish AmericanSpanish American IndianSri LankanSubsaharan AfricanSudaneseSwedishSwissSyrianTaiwaneseThaiTlingit-HaidaTohono O'OdhamTonganTrinidadian and TobagonianTsimshianTurkishU.S. Virgin IslanderUgandanUkrainianUruguayanUteVenezuelanVietnameseWelshWest IndianYakamaYaquiYugoslavianYumanYup'ikZimbabwean
Immigration
NonimmigrantsImmigrantsAfghanistanAfricaAlbaniaArgentinaArmeniaAsiaAustraliaAustriaBahamasBangladeshBarbadosBelarusBelgiumBelizeBoliviaBosnia and HerzegovinaBrazilBulgariaBurma/MyanmarCabo VerdeCambodiaCameroonCanadaCaribbeanCentral AmericaChileChinaColombiaCongoCosta RicaCroatiaCubaCzechoslovakiaDenmarkDominicaDominican RepublicEastern AfricaEastern AsiaEastern EuropeEcuadorEgyptEl SalvadorEnglandEritreaEthiopiaEuropeFijiFranceGermanyGhanaGreeceGrenadaGuatemalaGuyanaHaitiHondurasHong KongHungaryIndiaIndonesiaIranIraqIrelandIsraelItalyJamaicaJapanJordanKazakhstanKenyaKoreaKuwaitLaosLatin AmericaLatviaLebanonLiberiaLithuaniaMalaysiaMexicoMicronesiaMiddle AfricaMoldovaMoroccoNepalNetherlandsNicaraguaNigeriaNorth AmericaNorth MacedoniaNorthern AfricaNorthern EuropeNorwayOceaniaPakistanPanamaPeruPhilippinesPolandPortugalRomaniaRussiaSaudi ArabiaScotlandSenegalSerbiaSierra LeoneSingaporeSomaliaSouth AfricaSouth AmericaSouth Central AsiaSouth Eastern AsiaSouthern EuropeSpainSri LankaSt. Vincent and the GrenadinesSudanSwedenSwitzerlandSyriaTaiwanThailandTrinidad and TobagoTurkeyUgandaUkraineUruguayUzbekistanVenezuelaVietnamWest IndiesWestern AfricaWestern AsiaWestern EuropeYemenZaireZimbabweAzores
Child Poverty Under the Age of 16
Income
Poverty
Unemployment
Labor Participation
Family Structure
Vehicle Availability
Education Level
Disability

Child Poverty Under the Age of 16 Comparison

Afghans

Sub-Saharan Africans

Average
Tragic
16.2%
CHILD POVERTY UNDER THE AGE OF 16
52.3/ 100
METRIC RATING
172nd/ 347
METRIC RANK
19.9%
CHILD POVERTY UNDER THE AGE OF 16
0.0/ 100
METRIC RATING
279th/ 347
METRIC RANK

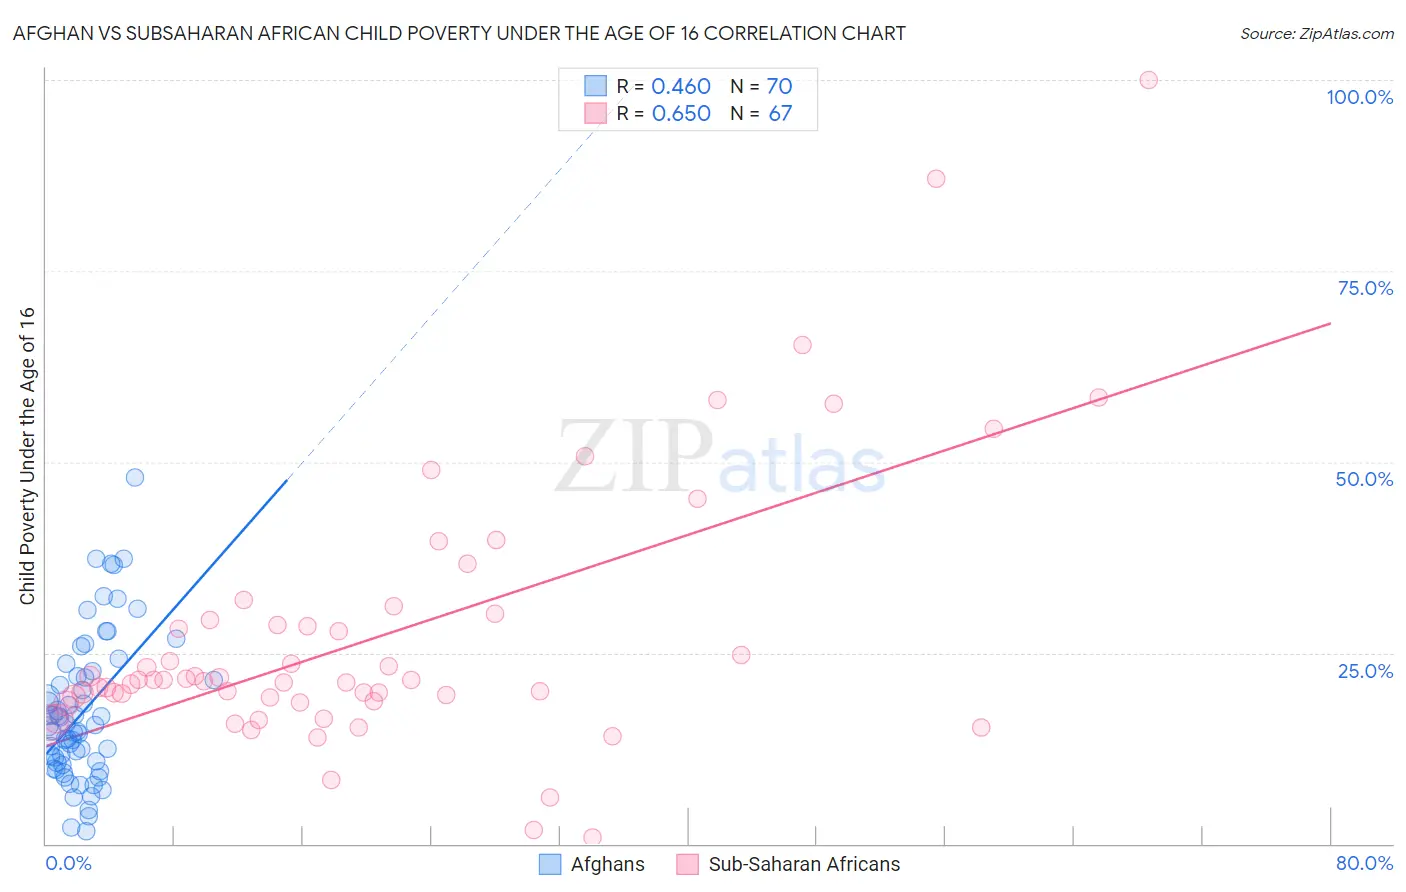
Afghan vs Subsaharan African Child Poverty Under the Age of 16 Correlation Chart

The statistical analysis conducted on geographies consisting of 148,458,786 people shows a moderate positive correlation between the proportion of Afghans and poverty level among children under the age of 16 in the United States with a correlation coefficient (R) of 0.460 and weighted average of 16.2%. Similarly, the statistical analysis conducted on geographies consisting of 502,334,948 people shows a significant positive correlation between the proportion of Sub-Saharan Africans and poverty level among children under the age of 16 in the United States with a correlation coefficient (R) of 0.650 and weighted average of 19.9%, a difference of 23.2%.
Afghan vs Subsaharan African Child Poverty Under the Age of 16

Child Poverty Under the Age of 16 Correlation Summary

MeasurementAfghanSubsaharan African
Minimum1.6%0.88%
Maximum48.0%100.0%
Range46.4%99.1%
Mean17.3%27.1%
Median15.5%21.4%
Interquartile 25% (IQ1)10.6%18.7%
Interquartile 75% (IQ3)21.9%29.3%
Interquartile Range (IQR)11.3%10.6%
Standard Deviation (Sample)9.5%17.7%
Standard Deviation (Population)9.4%17.5%

Similar Demographics by Child Poverty Under the Age of 16

Demographics Similar to Afghans by Child Poverty Under the Age of 16

In terms of child poverty under the age of 16, the demographic groups most similar to Afghans are Hungarian (16.2%, a difference of 0.020%), Immigrants from Saudi Arabia (16.2%, a difference of 0.020%), Immigrants from Colombia (16.1%, a difference of 0.26%), White/Caucasian (16.2%, a difference of 0.27%), and Uruguayan (16.1%, a difference of 0.29%).
DemographicsRating | RankChild Poverty Under the Age of 16
Guamanians/Chamorros
66.4
/100
|
#165
Good
15.9%
Immigrants | Oceania
65.4
/100
|
#166
Good
15.9%
Costa Ricans
61.1
/100
|
#167
Good
16.0%
South Americans
57.9
/100
|
#168
Average
16.0%
Uruguayans
54.7
/100
|
#169
Average
16.1%
Immigrants | Colombia
54.4
/100
|
#170
Average
16.1%
Hungarians
52.5
/100
|
#171
Average
16.2%
Afghans
52.3
/100
|
#172
Average
16.2%
Immigrants | Saudi Arabia
52.1
/100
|
#173
Average
16.2%
Whites/Caucasians
50.0
/100
|
#174
Average
16.2%
Scotch-Irish
47.1
/100
|
#175
Average
16.3%
Lebanese
45.9
/100
|
#176
Average
16.3%
Ethiopians
43.4
/100
|
#177
Average
16.3%
Immigrants | Ethiopia
42.3
/100
|
#178
Average
16.4%
Immigrants | Syria
42.3
/100
|
#179
Average
16.4%

Demographics Similar to Sub-Saharan Africans by Child Poverty Under the Age of 16

In terms of child poverty under the age of 16, the demographic groups most similar to Sub-Saharan Africans are Bangladeshi (19.9%, a difference of 0.010%), Comanche (19.9%, a difference of 0.010%), Iroquois (19.9%, a difference of 0.10%), Belizean (19.9%, a difference of 0.24%), and Immigrants from Cabo Verde (19.9%, a difference of 0.25%).
DemographicsRating | RankChild Poverty Under the Age of 16
Immigrants | Bangladesh
0.1
/100
|
#272
Tragic
19.8%
Immigrants | Jamaica
0.1
/100
|
#273
Tragic
19.8%
Immigrants | Cabo Verde
0.1
/100
|
#274
Tragic
19.9%
Immigrants | Barbados
0.1
/100
|
#275
Tragic
19.9%
Belizeans
0.1
/100
|
#276
Tragic
19.9%
Iroquois
0.1
/100
|
#277
Tragic
19.9%
Bangladeshis
0.0
/100
|
#278
Tragic
19.9%
Sub-Saharan Africans
0.0
/100
|
#279
Tragic
19.9%
Comanche
0.0
/100
|
#280
Tragic
19.9%
Central Americans
0.0
/100
|
#281
Tragic
20.0%
Barbadians
0.0
/100
|
#282
Tragic
20.0%
Immigrants | Zaire
0.0
/100
|
#283
Tragic
20.1%
West Indians
0.0
/100
|
#284
Tragic
20.1%
Immigrants | St. Vincent and the Grenadines
0.0
/100
|
#285
Tragic
20.1%
Immigrants | West Indies
0.0
/100
|
#286
Tragic
20.2%