Yugoslavian vs Immigrants from Belgium Unemployment
COMPARE
Yugoslavian
Immigrants from Belgium
Unemployment
Unemployment Comparison
Yugoslavians
Immigrants from Belgium
4.8%
UNEMPLOYMENT
99.5/ 100
METRIC RATING
43rd/ 347
METRIC RANK
4.9%
UNEMPLOYMENT
99.2/ 100
METRIC RATING
51st/ 347
METRIC RANK
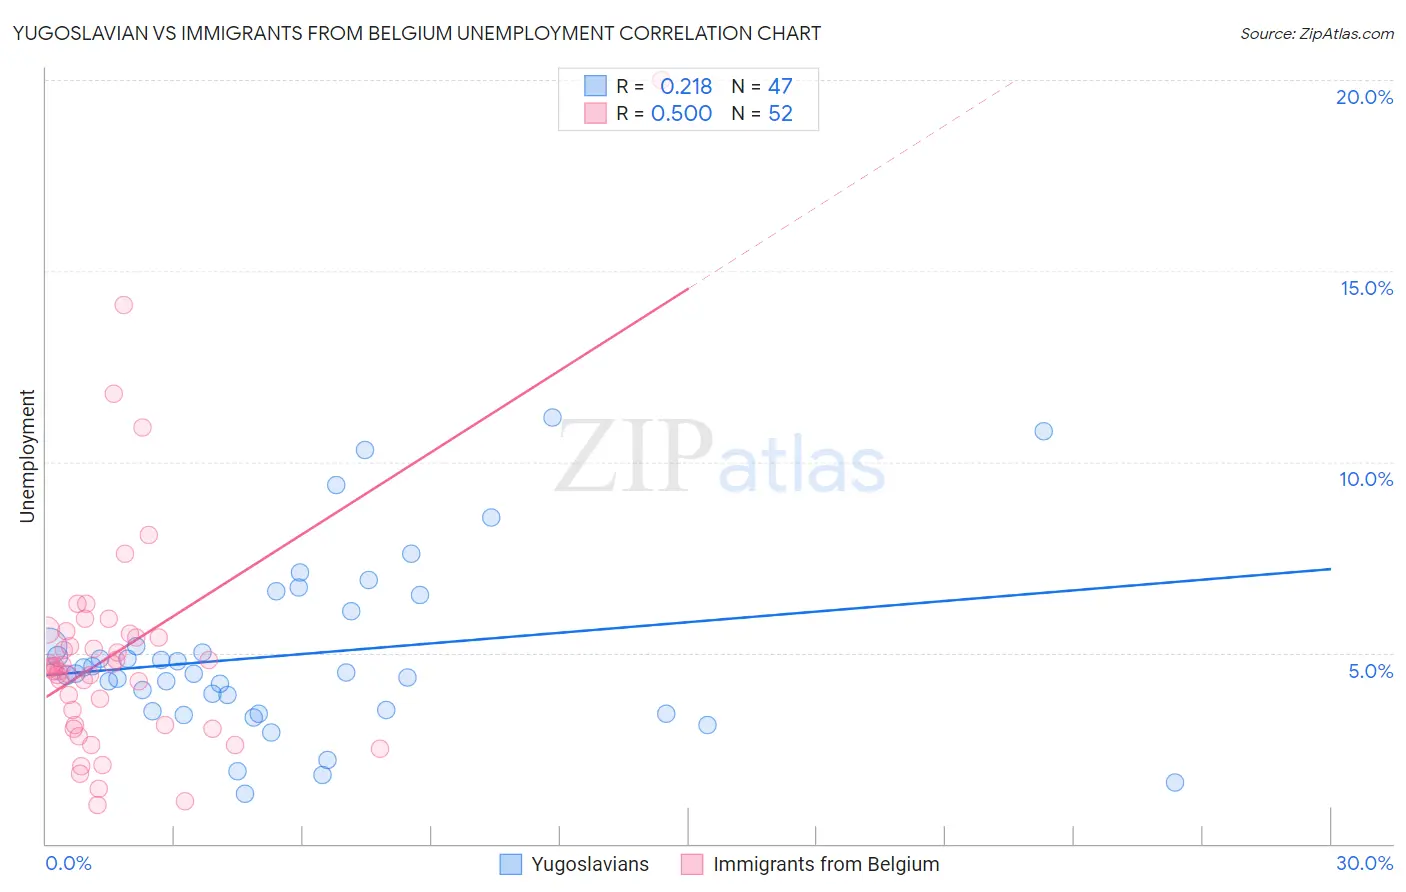
Yugoslavian vs Immigrants from Belgium Unemployment Correlation Chart
The statistical analysis conducted on geographies consisting of 285,527,553 people shows a weak positive correlation between the proportion of Yugoslavians and unemployment in the United States with a correlation coefficient (R) of 0.218 and weighted average of 4.8%. Similarly, the statistical analysis conducted on geographies consisting of 146,688,152 people shows a substantial positive correlation between the proportion of Immigrants from Belgium and unemployment in the United States with a correlation coefficient (R) of 0.500 and weighted average of 4.9%, a difference of 0.70%.
Unemployment Correlation Summary
| Measurement | Yugoslavian | Immigrants from Belgium |
| Minimum | 1.3% | 1.0% |
| Maximum | 11.2% | 20.0% |
| Range | 9.8% | 19.0% |
| Mean | 5.0% | 5.0% |
| Median | 4.5% | 4.6% |
| Interquartile 25% (IQ1) | 3.5% | 3.1% |
| Interquartile 75% (IQ3) | 6.1% | 5.4% |
| Interquartile Range (IQR) | 2.6% | 2.3% |
| Standard Deviation (Sample) | 2.3% | 3.2% |
| Standard Deviation (Population) | 2.3% | 3.2% |
Demographics Similar to Yugoslavians and Immigrants from Belgium by Unemployment
In terms of unemployment, the demographic groups most similar to Yugoslavians are Austrian (4.8%, a difference of 0.060%), French (4.8%, a difference of 0.11%), Filipino (4.8%, a difference of 0.20%), Immigrants from Nepal (4.8%, a difference of 0.28%), and Immigrants from Taiwan (4.8%, a difference of 0.30%). Similarly, the demographic groups most similar to Immigrants from Belgium are White/Caucasian (4.9%, a difference of 0.010%), Immigrants from Zimbabwe (4.9%, a difference of 0.040%), Eastern European (4.9%, a difference of 0.070%), Australian (4.9%, a difference of 0.10%), and French Canadian (4.9%, a difference of 0.16%).
| Demographics | Rating | Rank | Unemployment |
| Czechoslovakians | 99.7 /100 | #37 | Exceptional 4.8% |
| Bolivians | 99.7 /100 | #38 | Exceptional 4.8% |
| Lithuanians | 99.7 /100 | #39 | Exceptional 4.8% |
| Northern Europeans | 99.7 /100 | #40 | Exceptional 4.8% |
| Immigrants | Bosnia and Herzegovina | 99.7 /100 | #41 | Exceptional 4.8% |
| Filipinos | 99.5 /100 | #42 | Exceptional 4.8% |
| Yugoslavians | 99.5 /100 | #43 | Exceptional 4.8% |
| Austrians | 99.5 /100 | #44 | Exceptional 4.8% |
| French | 99.5 /100 | #45 | Exceptional 4.8% |
| Immigrants | Nepal | 99.4 /100 | #46 | Exceptional 4.8% |
| Immigrants | Taiwan | 99.4 /100 | #47 | Exceptional 4.8% |
| Immigrants | Scotland | 99.3 /100 | #48 | Exceptional 4.9% |
| Immigrants | South Central Asia | 99.3 /100 | #49 | Exceptional 4.9% |
| French Canadians | 99.3 /100 | #50 | Exceptional 4.9% |
| Immigrants | Belgium | 99.2 /100 | #51 | Exceptional 4.9% |
| Whites/Caucasians | 99.2 /100 | #52 | Exceptional 4.9% |
| Immigrants | Zimbabwe | 99.2 /100 | #53 | Exceptional 4.9% |
| Eastern Europeans | 99.2 /100 | #54 | Exceptional 4.9% |
| Australians | 99.2 /100 | #55 | Exceptional 4.9% |
| Celtics | 99.1 /100 | #56 | Exceptional 4.9% |
| Immigrants | Singapore | 99.1 /100 | #57 | Exceptional 4.9% |