Yugoslavian vs Immigrants from Albania Unemployment
COMPARE
Yugoslavian
Immigrants from Albania
Unemployment
Unemployment Comparison
Yugoslavians
Immigrants from Albania
4.8%
UNEMPLOYMENT
99.5/ 100
METRIC RATING
43rd/ 347
METRIC RANK
5.4%
UNEMPLOYMENT
13.5/ 100
METRIC RATING
217th/ 347
METRIC RANK
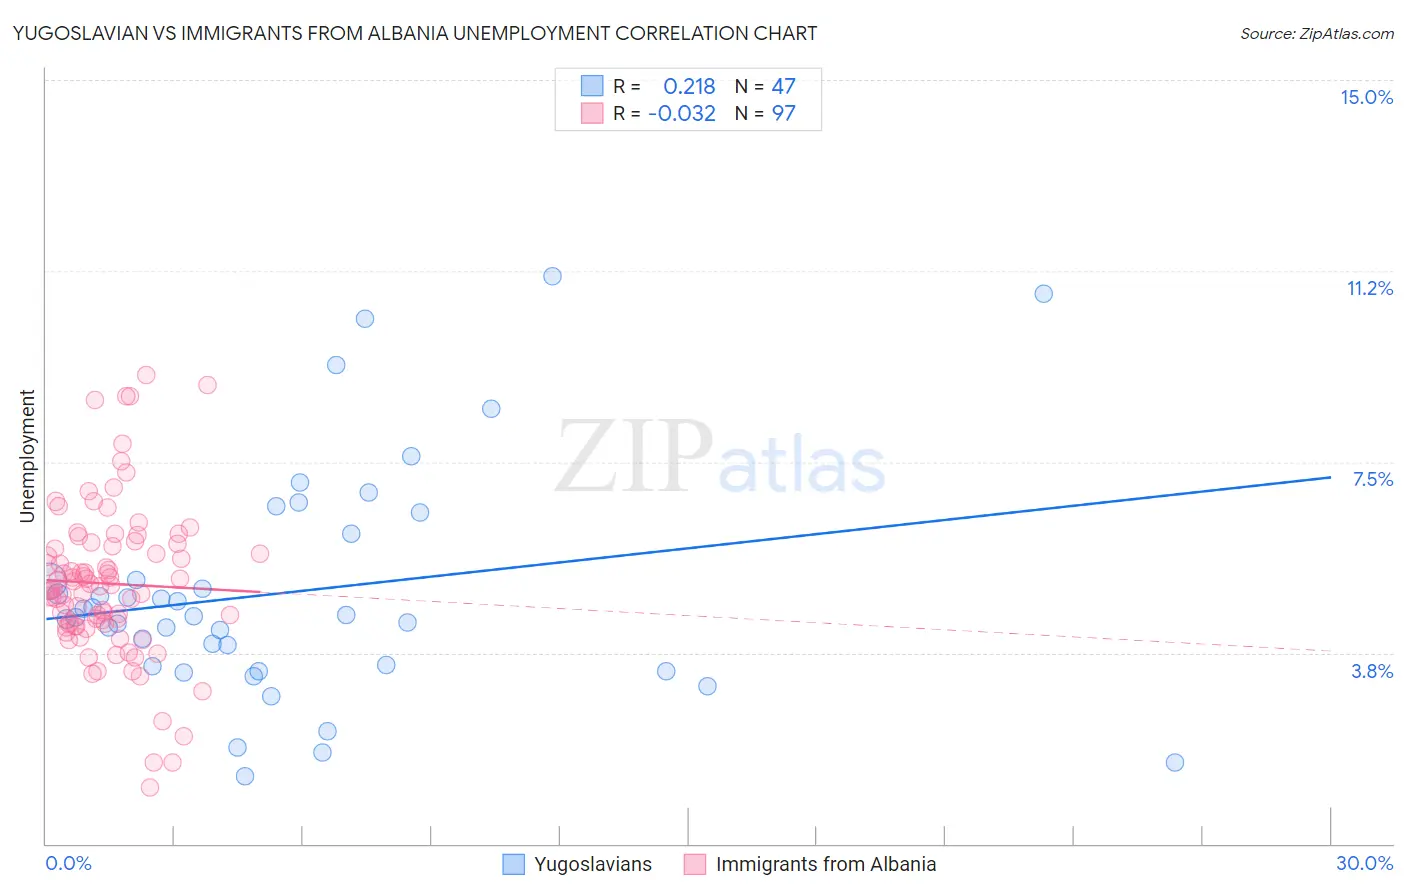
Yugoslavian vs Immigrants from Albania Unemployment Correlation Chart
The statistical analysis conducted on geographies consisting of 285,527,553 people shows a weak positive correlation between the proportion of Yugoslavians and unemployment in the United States with a correlation coefficient (R) of 0.218 and weighted average of 4.8%. Similarly, the statistical analysis conducted on geographies consisting of 119,392,247 people shows no correlation between the proportion of Immigrants from Albania and unemployment in the United States with a correlation coefficient (R) of -0.032 and weighted average of 5.4%, a difference of 11.9%.
Unemployment Correlation Summary
| Measurement | Yugoslavian | Immigrants from Albania |
| Minimum | 1.3% | 1.1% |
| Maximum | 11.2% | 9.2% |
| Range | 9.8% | 8.1% |
| Mean | 5.0% | 5.1% |
| Median | 4.5% | 5.0% |
| Interquartile 25% (IQ1) | 3.5% | 4.3% |
| Interquartile 75% (IQ3) | 6.1% | 5.9% |
| Interquartile Range (IQR) | 2.6% | 1.6% |
| Standard Deviation (Sample) | 2.3% | 1.5% |
| Standard Deviation (Population) | 2.3% | 1.5% |
Similar Demographics by Unemployment
Demographics Similar to Yugoslavians by Unemployment
In terms of unemployment, the demographic groups most similar to Yugoslavians are Austrian (4.8%, a difference of 0.060%), French (4.8%, a difference of 0.11%), Filipino (4.8%, a difference of 0.20%), Immigrants from Nepal (4.8%, a difference of 0.28%), and Immigrants from Taiwan (4.8%, a difference of 0.30%).
| Demographics | Rating | Rank | Unemployment |
| Tongans | 99.7 /100 | #36 | Exceptional 4.8% |
| Czechoslovakians | 99.7 /100 | #37 | Exceptional 4.8% |
| Bolivians | 99.7 /100 | #38 | Exceptional 4.8% |
| Lithuanians | 99.7 /100 | #39 | Exceptional 4.8% |
| Northern Europeans | 99.7 /100 | #40 | Exceptional 4.8% |
| Immigrants | Bosnia and Herzegovina | 99.7 /100 | #41 | Exceptional 4.8% |
| Filipinos | 99.5 /100 | #42 | Exceptional 4.8% |
| Yugoslavians | 99.5 /100 | #43 | Exceptional 4.8% |
| Austrians | 99.5 /100 | #44 | Exceptional 4.8% |
| French | 99.5 /100 | #45 | Exceptional 4.8% |
| Immigrants | Nepal | 99.4 /100 | #46 | Exceptional 4.8% |
| Immigrants | Taiwan | 99.4 /100 | #47 | Exceptional 4.8% |
| Immigrants | Scotland | 99.3 /100 | #48 | Exceptional 4.9% |
| Immigrants | South Central Asia | 99.3 /100 | #49 | Exceptional 4.9% |
| French Canadians | 99.3 /100 | #50 | Exceptional 4.9% |
Demographics Similar to Immigrants from Albania by Unemployment
In terms of unemployment, the demographic groups most similar to Immigrants from Albania are Immigrants from South America (5.4%, a difference of 0.0%), Choctaw (5.4%, a difference of 0.10%), Delaware (5.4%, a difference of 0.16%), Immigrants from Middle Africa (5.4%, a difference of 0.22%), and Immigrants from Costa Rica (5.4%, a difference of 0.22%).
| Demographics | Rating | Rank | Unemployment |
| Immigrants | Iraq | 18.6 /100 | #210 | Poor 5.4% |
| Iraqis | 18.1 /100 | #211 | Poor 5.4% |
| Ugandans | 18.0 /100 | #212 | Poor 5.4% |
| Immigrants | Middle Africa | 15.3 /100 | #213 | Poor 5.4% |
| Immigrants | Costa Rica | 15.2 /100 | #214 | Poor 5.4% |
| Delaware | 14.7 /100 | #215 | Poor 5.4% |
| Immigrants | South America | 13.5 /100 | #216 | Poor 5.4% |
| Immigrants | Albania | 13.5 /100 | #217 | Poor 5.4% |
| Choctaw | 12.7 /100 | #218 | Poor 5.4% |
| Bangladeshis | 11.2 /100 | #219 | Poor 5.4% |
| Soviet Union | 10.6 /100 | #220 | Poor 5.4% |
| Immigrants | Philippines | 10.4 /100 | #221 | Poor 5.4% |
| Iroquois | 10.3 /100 | #222 | Poor 5.4% |
| Seminole | 9.2 /100 | #223 | Tragic 5.4% |
| Israelis | 8.8 /100 | #224 | Tragic 5.4% |