Yakama vs Immigrants from Italy Unemployment Among Women with Children Ages 6 to 17 years
COMPARE
Yakama
Immigrants from Italy
Unemployment Among Women with Children Ages 6 to 17 years
Unemployment Among Women with Children Ages 6 to 17 years Comparison
Yakama
Immigrants from Italy
9.9%
UNEMPLOYMENT AMONG WOMEN WITH CHILDREN AGES 6 TO 17 YEARS
0.0/ 100
METRIC RATING
284th/ 347
METRIC RANK
9.0%
UNEMPLOYMENT AMONG WOMEN WITH CHILDREN AGES 6 TO 17 YEARS
43.7/ 100
METRIC RATING
176th/ 347
METRIC RANK
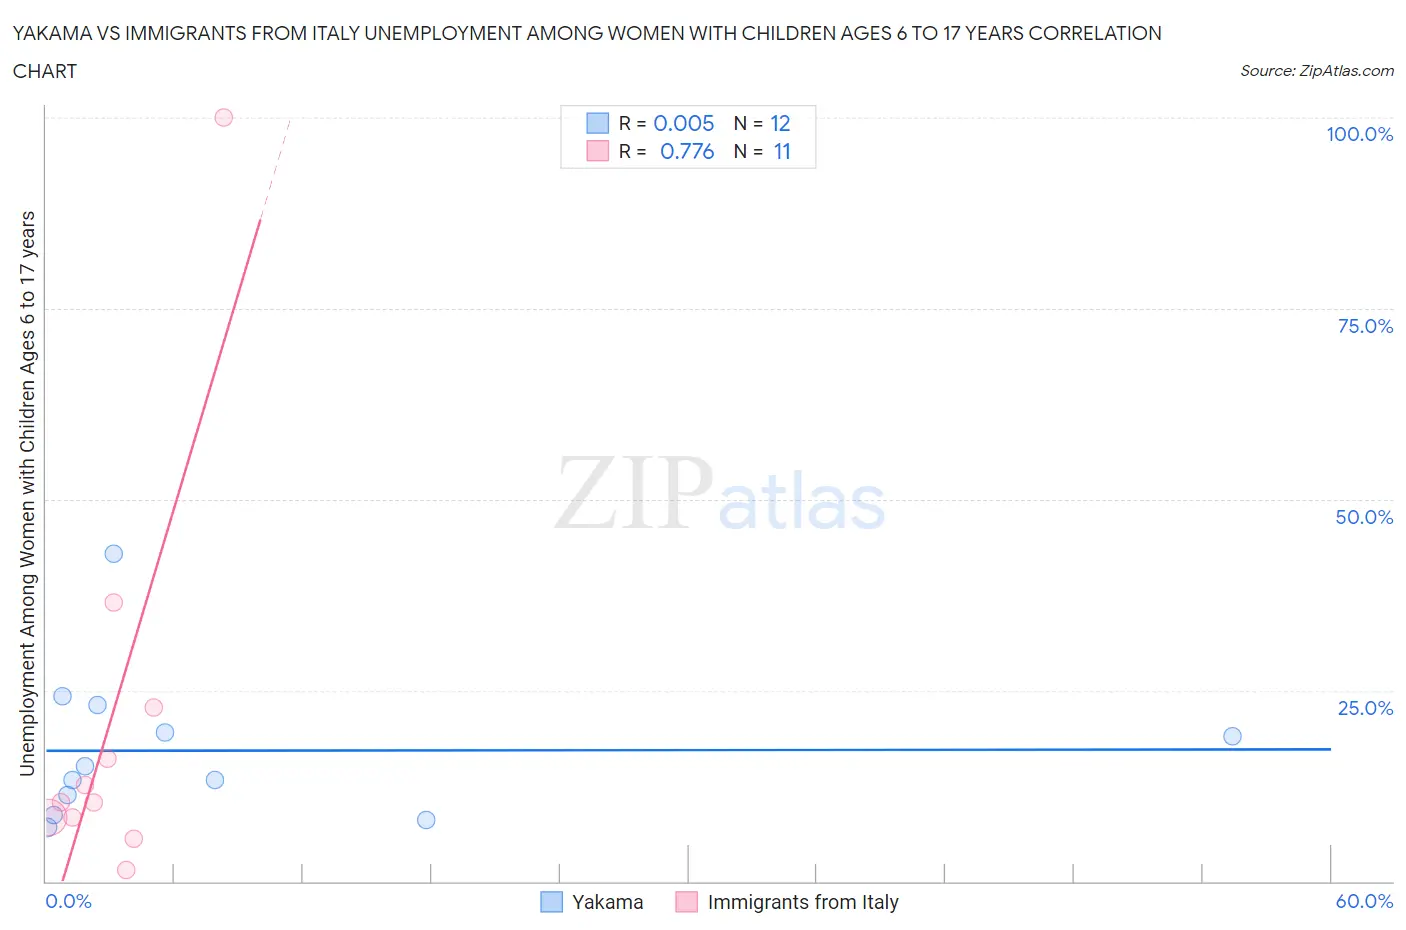
Yakama vs Immigrants from Italy Unemployment Among Women with Children Ages 6 to 17 years Correlation Chart
The statistical analysis conducted on geographies consisting of 17,342,387 people shows no correlation between the proportion of Yakama and unemployment rate among women with children between the ages 6 and 17 in the United States with a correlation coefficient (R) of 0.005 and weighted average of 9.9%. Similarly, the statistical analysis conducted on geographies consisting of 237,959,697 people shows a strong positive correlation between the proportion of Immigrants from Italy and unemployment rate among women with children between the ages 6 and 17 in the United States with a correlation coefficient (R) of 0.776 and weighted average of 9.0%, a difference of 10.0%.
Unemployment Among Women with Children Ages 6 to 17 years Correlation Summary
| Measurement | Yakama | Immigrants from Italy |
| Minimum | 7.1% | 1.4% |
| Maximum | 42.9% | 100.0% |
| Range | 35.8% | 98.6% |
| Mean | 17.1% | 21.1% |
| Median | 14.2% | 10.4% |
| Interquartile 25% (IQ1) | 10.0% | 8.4% |
| Interquartile 75% (IQ3) | 21.2% | 22.7% |
| Interquartile Range (IQR) | 11.2% | 14.3% |
| Standard Deviation (Sample) | 9.9% | 27.8% |
| Standard Deviation (Population) | 9.5% | 26.5% |
Similar Demographics by Unemployment Among Women with Children Ages 6 to 17 years
Demographics Similar to Yakama by Unemployment Among Women with Children Ages 6 to 17 years
In terms of unemployment among women with children ages 6 to 17 years, the demographic groups most similar to Yakama are Central American Indian (9.9%, a difference of 0.15%), Hispanic or Latino (9.9%, a difference of 0.31%), Choctaw (9.9%, a difference of 0.43%), Sierra Leonean (9.9%, a difference of 0.47%), and Shoshone (10.0%, a difference of 0.72%).
| Demographics | Rating | Rank | Unemployment Among Women with Children Ages 6 to 17 years |
| British West Indians | 0.1 /100 | #277 | Tragic 9.7% |
| French | 0.1 /100 | #278 | Tragic 9.7% |
| Scotch-Irish | 0.1 /100 | #279 | Tragic 9.7% |
| Seminole | 0.1 /100 | #280 | Tragic 9.7% |
| Jamaicans | 0.0 /100 | #281 | Tragic 9.8% |
| Slovaks | 0.0 /100 | #282 | Tragic 9.8% |
| Central American Indians | 0.0 /100 | #283 | Tragic 9.9% |
| Yakama | 0.0 /100 | #284 | Tragic 9.9% |
| Hispanics or Latinos | 0.0 /100 | #285 | Tragic 9.9% |
| Choctaw | 0.0 /100 | #286 | Tragic 9.9% |
| Sierra Leoneans | 0.0 /100 | #287 | Tragic 9.9% |
| Shoshone | 0.0 /100 | #288 | Tragic 10.0% |
| Hondurans | 0.0 /100 | #289 | Tragic 10.0% |
| Sub-Saharan Africans | 0.0 /100 | #290 | Tragic 10.0% |
| Immigrants | Nonimmigrants | 0.0 /100 | #291 | Tragic 10.0% |
Demographics Similar to Immigrants from Italy by Unemployment Among Women with Children Ages 6 to 17 years
In terms of unemployment among women with children ages 6 to 17 years, the demographic groups most similar to Immigrants from Italy are Immigrants from Sierra Leone (9.0%, a difference of 0.10%), Immigrants from Jordan (9.0%, a difference of 0.10%), Menominee (9.0%, a difference of 0.20%), Immigrants from Zaire (9.0%, a difference of 0.25%), and Immigrants from Costa Rica (9.0%, a difference of 0.28%).
| Demographics | Rating | Rank | Unemployment Among Women with Children Ages 6 to 17 years |
| British | 55.2 /100 | #169 | Average 8.9% |
| Turks | 54.1 /100 | #170 | Average 8.9% |
| Jordanians | 52.2 /100 | #171 | Average 9.0% |
| Immigrants | West Indies | 52.2 /100 | #172 | Average 9.0% |
| Immigrants | Brazil | 51.0 /100 | #173 | Average 9.0% |
| Immigrants | Costa Rica | 50.0 /100 | #174 | Average 9.0% |
| Immigrants | Sierra Leone | 45.9 /100 | #175 | Average 9.0% |
| Immigrants | Italy | 43.7 /100 | #176 | Average 9.0% |
| Immigrants | Jordan | 41.6 /100 | #177 | Average 9.0% |
| Menominee | 39.3 /100 | #178 | Fair 9.0% |
| Immigrants | Zaire | 38.3 /100 | #179 | Fair 9.0% |
| Ethiopians | 37.6 /100 | #180 | Fair 9.0% |
| Immigrants | Czechoslovakia | 34.5 /100 | #181 | Fair 9.0% |
| South American Indians | 34.4 /100 | #182 | Fair 9.0% |
| Swiss | 33.5 /100 | #183 | Fair 9.0% |