Yakama vs Immigrants from Italy Kindergarten
COMPARE
Yakama
Immigrants from Italy
Kindergarten
Kindergarten Comparison
Yakama
Immigrants from Italy
96.6%
KINDERGARTEN
0.0/ 100
METRIC RATING
332nd/ 347
METRIC RANK
98.0%
KINDERGARTEN
58.9/ 100
METRIC RATING
162nd/ 347
METRIC RANK
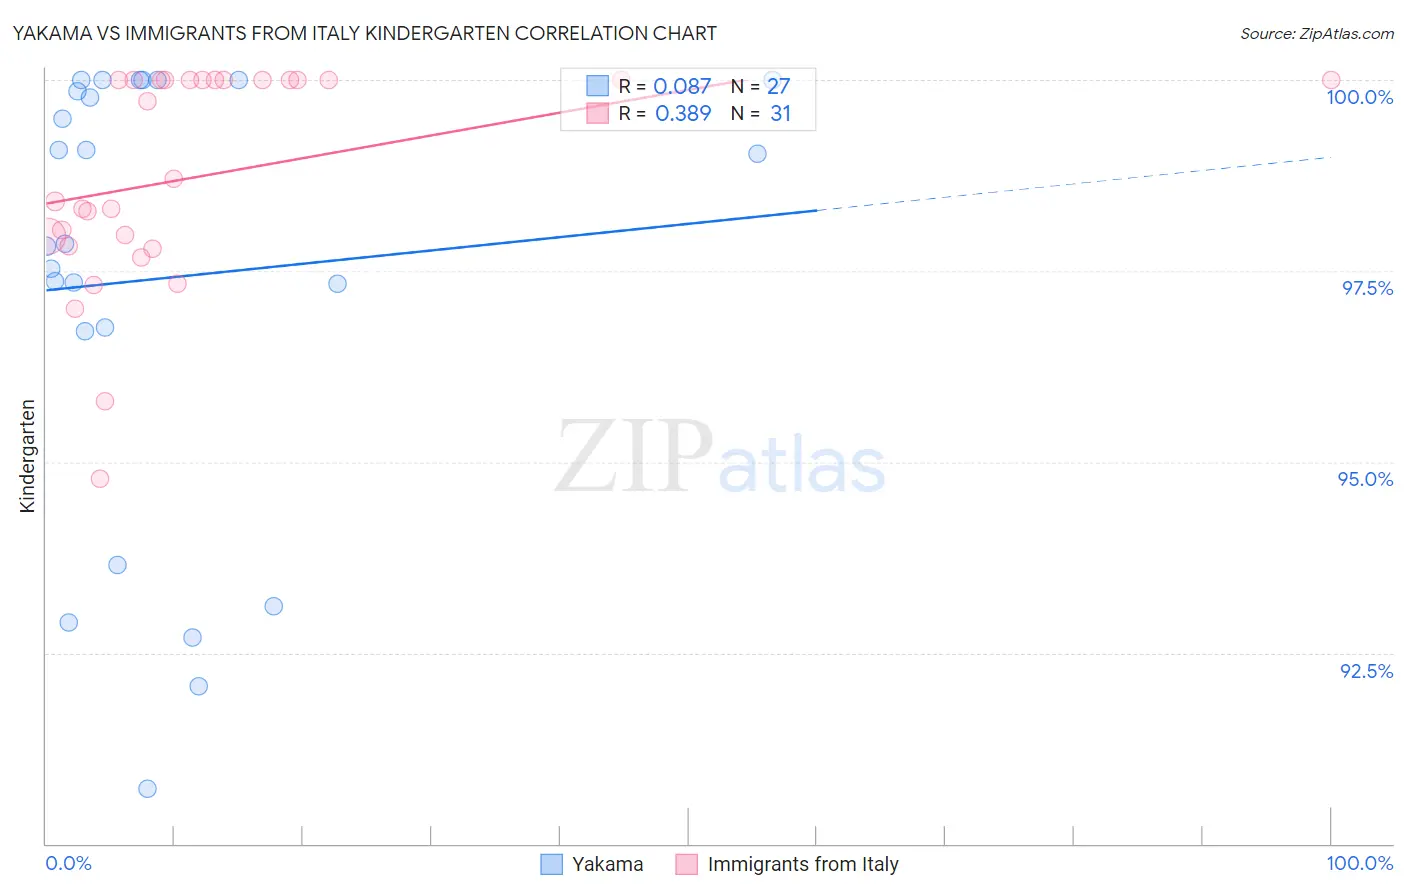
Yakama vs Immigrants from Italy Kindergarten Correlation Chart
The statistical analysis conducted on geographies consisting of 19,923,144 people shows a slight positive correlation between the proportion of Yakama and percentage of population with at least kindergarten education in the United States with a correlation coefficient (R) of 0.087 and weighted average of 96.6%. Similarly, the statistical analysis conducted on geographies consisting of 324,225,917 people shows a mild positive correlation between the proportion of Immigrants from Italy and percentage of population with at least kindergarten education in the United States with a correlation coefficient (R) of 0.389 and weighted average of 98.0%, a difference of 1.4%.
Kindergarten Correlation Summary
| Measurement | Yakama | Immigrants from Italy |
| Minimum | 90.7% | 94.8% |
| Maximum | 100.0% | 100.0% |
| Range | 9.3% | 5.2% |
| Mean | 97.4% | 98.7% |
| Median | 97.9% | 98.7% |
| Interquartile 25% (IQ1) | 96.7% | 97.8% |
| Interquartile 75% (IQ3) | 100.0% | 100.0% |
| Interquartile Range (IQR) | 3.3% | 2.2% |
| Standard Deviation (Sample) | 2.9% | 1.4% |
| Standard Deviation (Population) | 2.9% | 1.4% |
Similar Demographics by Kindergarten
Demographics Similar to Yakama by Kindergarten
In terms of kindergarten, the demographic groups most similar to Yakama are Immigrants from Armenia (96.6%, a difference of 0.020%), Central American (96.6%, a difference of 0.020%), Immigrants from Dominican Republic (96.6%, a difference of 0.040%), Immigrants from Vietnam (96.7%, a difference of 0.050%), and Japanese (96.7%, a difference of 0.050%).
| Demographics | Rating | Rank | Kindergarten |
| Indonesians | 0.0 /100 | #325 | Tragic 96.8% |
| Dominicans | 0.0 /100 | #326 | Tragic 96.8% |
| Mexicans | 0.0 /100 | #327 | Tragic 96.7% |
| Immigrants | Latin America | 0.0 /100 | #328 | Tragic 96.7% |
| Immigrants | Vietnam | 0.0 /100 | #329 | Tragic 96.7% |
| Japanese | 0.0 /100 | #330 | Tragic 96.7% |
| Immigrants | Armenia | 0.0 /100 | #331 | Tragic 96.6% |
| Yakama | 0.0 /100 | #332 | Tragic 96.6% |
| Central Americans | 0.0 /100 | #333 | Tragic 96.6% |
| Immigrants | Dominican Republic | 0.0 /100 | #334 | Tragic 96.6% |
| Bangladeshis | 0.0 /100 | #335 | Tragic 96.6% |
| Guatemalans | 0.0 /100 | #336 | Tragic 96.5% |
| Immigrants | Cambodia | 0.0 /100 | #337 | Tragic 96.5% |
| Immigrants | Fiji | 0.0 /100 | #338 | Tragic 96.5% |
| Immigrants | Guatemala | 0.0 /100 | #339 | Tragic 96.4% |
Demographics Similar to Immigrants from Italy by Kindergarten
In terms of kindergarten, the demographic groups most similar to Immigrants from Italy are Immigrants from Russia (98.0%, a difference of 0.0%), Immigrants from Eastern Europe (98.0%, a difference of 0.0%), Spanish American (98.0%, a difference of 0.0%), Immigrants from Micronesia (98.0%, a difference of 0.0%), and Ugandan (98.0%, a difference of 0.010%).
| Demographics | Rating | Rank | Kindergarten |
| Comanche | 68.3 /100 | #155 | Good 98.0% |
| Immigrants | South Central Asia | 66.6 /100 | #156 | Good 98.0% |
| Immigrants | North Macedonia | 66.4 /100 | #157 | Good 98.0% |
| Venezuelans | 64.7 /100 | #158 | Good 98.0% |
| French American Indians | 63.7 /100 | #159 | Good 98.0% |
| Immigrants | Russia | 59.0 /100 | #160 | Average 98.0% |
| Immigrants | Eastern Europe | 59.0 /100 | #161 | Average 98.0% |
| Immigrants | Italy | 58.9 /100 | #162 | Average 98.0% |
| Spanish Americans | 57.8 /100 | #163 | Average 98.0% |
| Immigrants | Micronesia | 57.7 /100 | #164 | Average 98.0% |
| Ugandans | 56.9 /100 | #165 | Average 98.0% |
| Chileans | 56.3 /100 | #166 | Average 98.0% |
| Immigrants | Spain | 54.6 /100 | #167 | Average 98.0% |
| Navajo | 54.4 /100 | #168 | Average 98.0% |
| Immigrants | Korea | 54.1 /100 | #169 | Average 98.0% |