Yakama vs Immigrants from Middle Africa Unemployment Among Women with Children Ages 6 to 17 years
COMPARE
Yakama
Immigrants from Middle Africa
Unemployment Among Women with Children Ages 6 to 17 years
Unemployment Among Women with Children Ages 6 to 17 years Comparison
Yakama
Immigrants from Middle Africa
9.9%
UNEMPLOYMENT AMONG WOMEN WITH CHILDREN AGES 6 TO 17 YEARS
0.0/ 100
METRIC RATING
284th/ 347
METRIC RANK
9.1%
UNEMPLOYMENT AMONG WOMEN WITH CHILDREN AGES 6 TO 17 YEARS
15.6/ 100
METRIC RATING
202nd/ 347
METRIC RANK
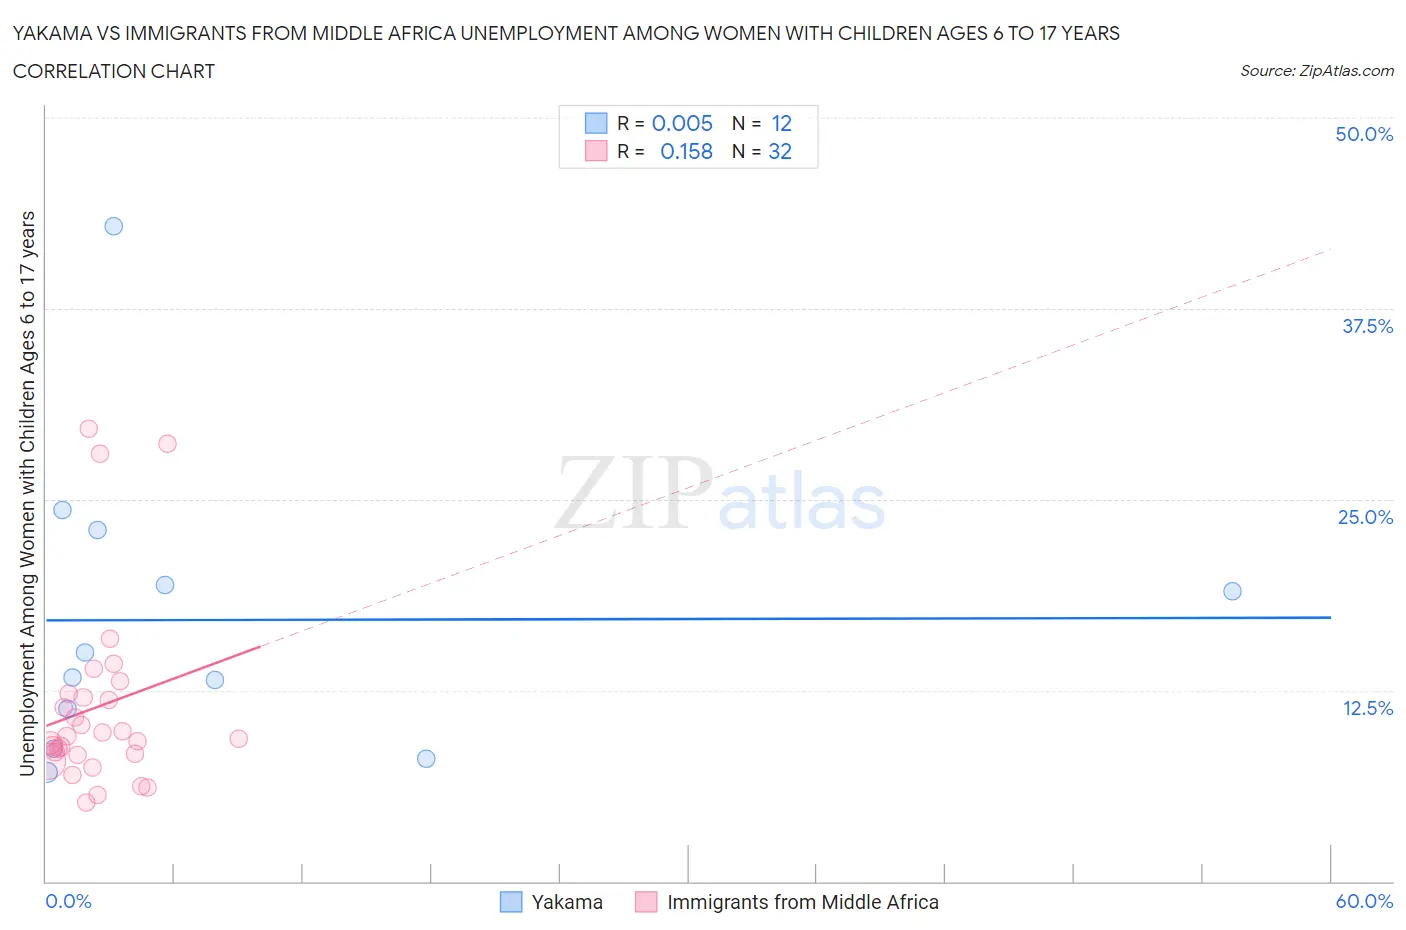
Yakama vs Immigrants from Middle Africa Unemployment Among Women with Children Ages 6 to 17 years Correlation Chart
The statistical analysis conducted on geographies consisting of 17,342,387 people shows no correlation between the proportion of Yakama and unemployment rate among women with children between the ages 6 and 17 in the United States with a correlation coefficient (R) of 0.005 and weighted average of 9.9%. Similarly, the statistical analysis conducted on geographies consisting of 167,126,033 people shows a poor positive correlation between the proportion of Immigrants from Middle Africa and unemployment rate among women with children between the ages 6 and 17 in the United States with a correlation coefficient (R) of 0.158 and weighted average of 9.1%, a difference of 8.3%.
Unemployment Among Women with Children Ages 6 to 17 years Correlation Summary
| Measurement | Yakama | Immigrants from Middle Africa |
| Minimum | 7.1% | 5.1% |
| Maximum | 42.9% | 29.6% |
| Range | 35.8% | 24.5% |
| Mean | 17.1% | 11.4% |
| Median | 14.2% | 9.4% |
| Interquartile 25% (IQ1) | 10.0% | 8.3% |
| Interquartile 75% (IQ3) | 21.2% | 12.2% |
| Interquartile Range (IQR) | 11.2% | 3.9% |
| Standard Deviation (Sample) | 9.9% | 6.2% |
| Standard Deviation (Population) | 9.5% | 6.1% |
Similar Demographics by Unemployment Among Women with Children Ages 6 to 17 years
Demographics Similar to Yakama by Unemployment Among Women with Children Ages 6 to 17 years
In terms of unemployment among women with children ages 6 to 17 years, the demographic groups most similar to Yakama are Central American Indian (9.9%, a difference of 0.15%), Hispanic or Latino (9.9%, a difference of 0.31%), Choctaw (9.9%, a difference of 0.43%), Sierra Leonean (9.9%, a difference of 0.47%), and Shoshone (10.0%, a difference of 0.72%).
| Demographics | Rating | Rank | Unemployment Among Women with Children Ages 6 to 17 years |
| British West Indians | 0.1 /100 | #277 | Tragic 9.7% |
| French | 0.1 /100 | #278 | Tragic 9.7% |
| Scotch-Irish | 0.1 /100 | #279 | Tragic 9.7% |
| Seminole | 0.1 /100 | #280 | Tragic 9.7% |
| Jamaicans | 0.0 /100 | #281 | Tragic 9.8% |
| Slovaks | 0.0 /100 | #282 | Tragic 9.8% |
| Central American Indians | 0.0 /100 | #283 | Tragic 9.9% |
| Yakama | 0.0 /100 | #284 | Tragic 9.9% |
| Hispanics or Latinos | 0.0 /100 | #285 | Tragic 9.9% |
| Choctaw | 0.0 /100 | #286 | Tragic 9.9% |
| Sierra Leoneans | 0.0 /100 | #287 | Tragic 9.9% |
| Shoshone | 0.0 /100 | #288 | Tragic 10.0% |
| Hondurans | 0.0 /100 | #289 | Tragic 10.0% |
| Sub-Saharan Africans | 0.0 /100 | #290 | Tragic 10.0% |
| Immigrants | Nonimmigrants | 0.0 /100 | #291 | Tragic 10.0% |
Demographics Similar to Immigrants from Middle Africa by Unemployment Among Women with Children Ages 6 to 17 years
In terms of unemployment among women with children ages 6 to 17 years, the demographic groups most similar to Immigrants from Middle Africa are Maltese (9.1%, a difference of 0.020%), Immigrants from Canada (9.1%, a difference of 0.020%), Immigrants from Trinidad and Tobago (9.1%, a difference of 0.090%), Immigrants from Western Europe (9.1%, a difference of 0.13%), and Trinidadian and Tobagonian (9.1%, a difference of 0.20%).
| Demographics | Rating | Rank | Unemployment Among Women with Children Ages 6 to 17 years |
| Austrians | 25.0 /100 | #195 | Fair 9.1% |
| Brazilians | 24.4 /100 | #196 | Fair 9.1% |
| Immigrants | Panama | 24.3 /100 | #197 | Fair 9.1% |
| Guyanese | 21.8 /100 | #198 | Fair 9.1% |
| Czechoslovakians | 20.8 /100 | #199 | Fair 9.1% |
| Trinidadians and Tobagonians | 18.2 /100 | #200 | Poor 9.1% |
| Immigrants | Trinidad and Tobago | 16.7 /100 | #201 | Poor 9.1% |
| Immigrants | Middle Africa | 15.6 /100 | #202 | Poor 9.1% |
| Maltese | 15.3 /100 | #203 | Poor 9.1% |
| Immigrants | Canada | 15.3 /100 | #204 | Poor 9.1% |
| Immigrants | Western Europe | 14.1 /100 | #205 | Poor 9.1% |
| Immigrants | North America | 12.7 /100 | #206 | Poor 9.2% |
| Cubans | 10.9 /100 | #207 | Poor 9.2% |
| Immigrants | Peru | 10.8 /100 | #208 | Poor 9.2% |
| Salvadorans | 10.7 /100 | #209 | Poor 9.2% |